Fig. 5
Download original image
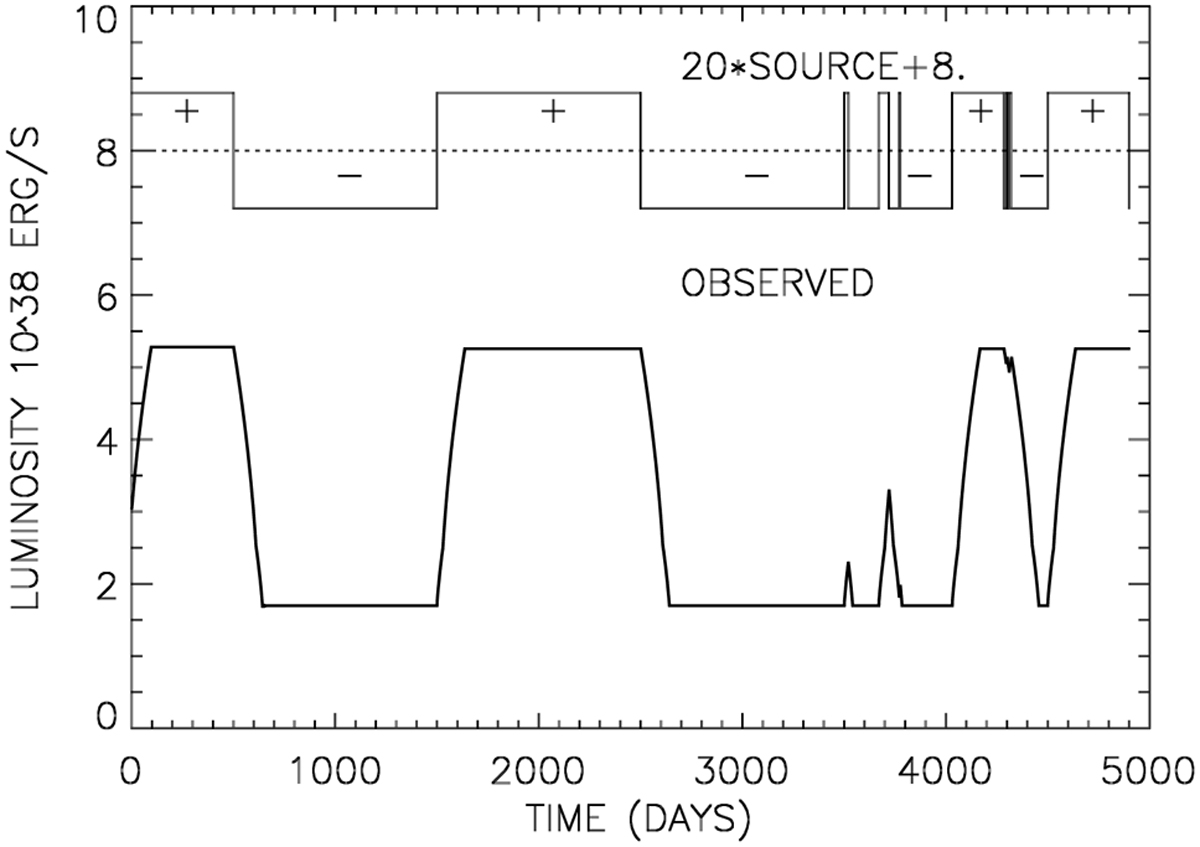
Upper part of the plot: randomly selected box-like time profile for ϵ (=SOURCE, in the plot multiplied by 20). Lower plot: observed luminosity after the feedback steps outlined in Sect. 2. The plus and minus signs in the upper plot mark the times of positive and negative feedback, respectively (ϵ positive or negative). See text for details.
Current usage metrics show cumulative count of Article Views (full-text article views including HTML views, PDF and ePub downloads, according to the available data) and Abstracts Views on Vision4Press platform.
Data correspond to usage on the plateform after 2015. The current usage metrics is available 48-96 hours after online publication and is updated daily on week days.
Initial download of the metrics may take a while.