Fig. 10
Download original image
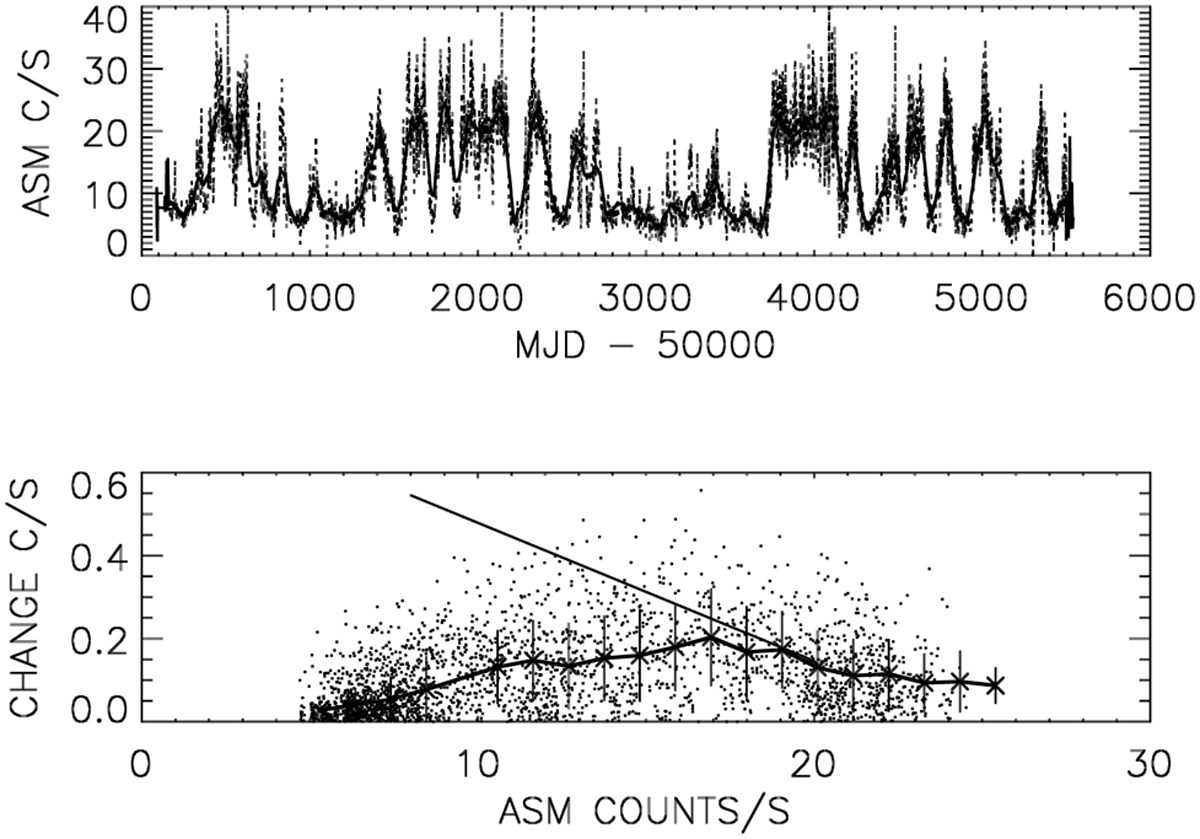
Upper panel: RXTE/ASM daily light curve of Cyg X-3 (the dotted line) overplotted with the smoothed version used for timescale estimates (the solid thick line). Lower panel: mean daily changes (counts s−1, the solid thick line) with error bars. Dots give individual daily changes. The solid linear line gives a comparison with the timescales used in Sect. 3 (see the text).
Current usage metrics show cumulative count of Article Views (full-text article views including HTML views, PDF and ePub downloads, according to the available data) and Abstracts Views on Vision4Press platform.
Data correspond to usage on the plateform after 2015. The current usage metrics is available 48-96 hours after online publication and is updated daily on week days.
Initial download of the metrics may take a while.