Fig. 8
Download original image
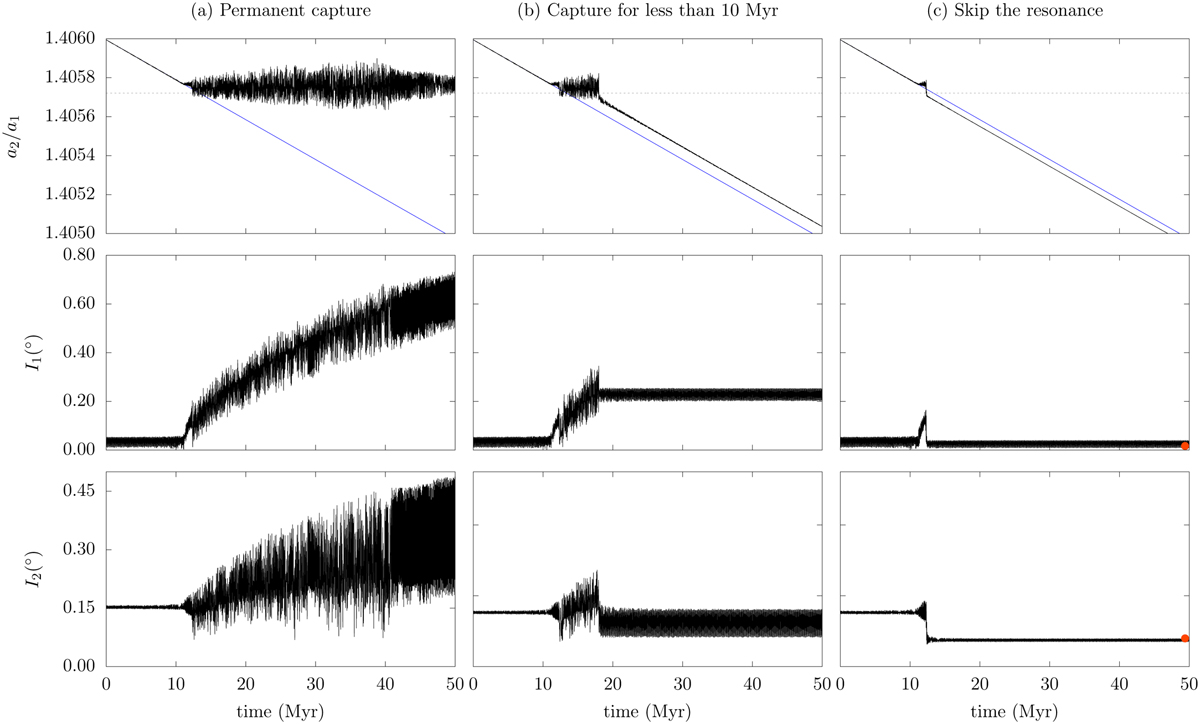
Three examples of a system crossing the 5/3 MMR with initial I1 = 0.05° and I2 = 0.15º (set #17 in Table 2). We show the ratio between the semi-major axes (top), the inclination of Ariel (middle), and the inclination of Umbriel (bottom) as a function of time. Each column corresponds to a different simulation. We show an example of a system that is permanently caught in resonance (a), one that is captured but evades the resonance in less than 10 Myr (b), and another that skips the resonance without capture (c). The blue line gives the asymptotic evolution predicted by Eq. (73), while the dashed line gives the position of the nominal resonance Eq. (77). The orange dots mark the present mean inclinations (Table 1).
Current usage metrics show cumulative count of Article Views (full-text article views including HTML views, PDF and ePub downloads, according to the available data) and Abstracts Views on Vision4Press platform.
Data correspond to usage on the plateform after 2015. The current usage metrics is available 48-96 hours after online publication and is updated daily on week days.
Initial download of the metrics may take a while.