Open Access
Fig. 6
Download original image
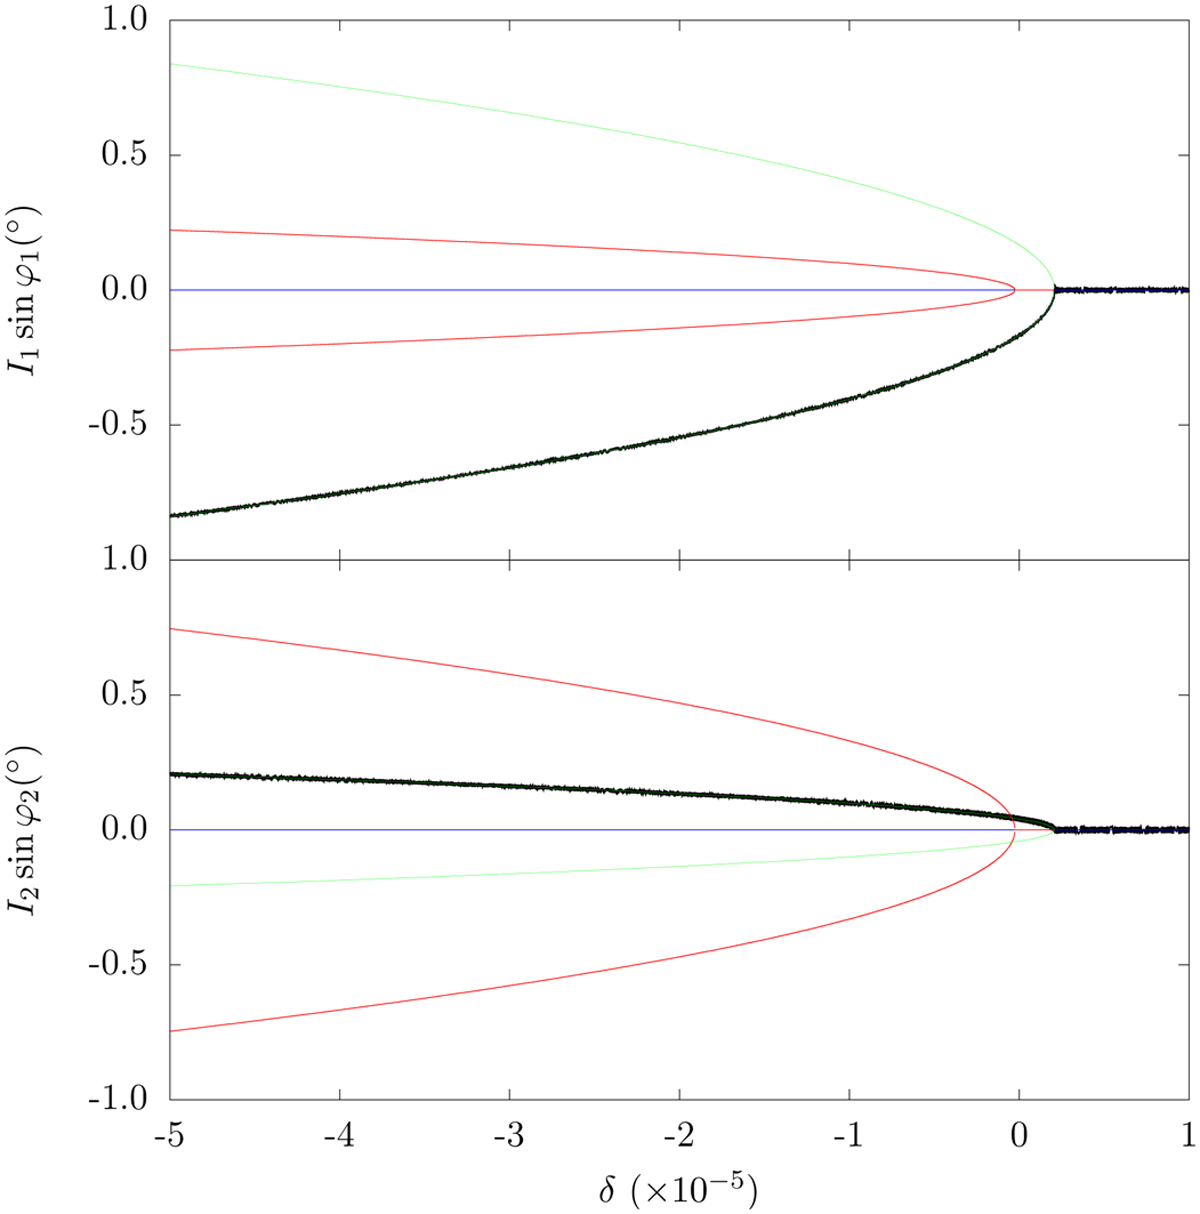
Tidal evolution of the system as function of δ for initial inclinations I1 = I2 = 0.01°. The results of the numerical simulation (in black) are superimposed in the equilibria map (Fig. 1). We show the evolution for the resonant angle ϕ1 (top) and ϕ2 (bottom).
Current usage metrics show cumulative count of Article Views (full-text article views including HTML views, PDF and ePub downloads, according to the available data) and Abstracts Views on Vision4Press platform.
Data correspond to usage on the plateform after 2015. The current usage metrics is available 48-96 hours after online publication and is updated daily on week days.
Initial download of the metrics may take a while.