Open Access
Fig. 5
Download original image
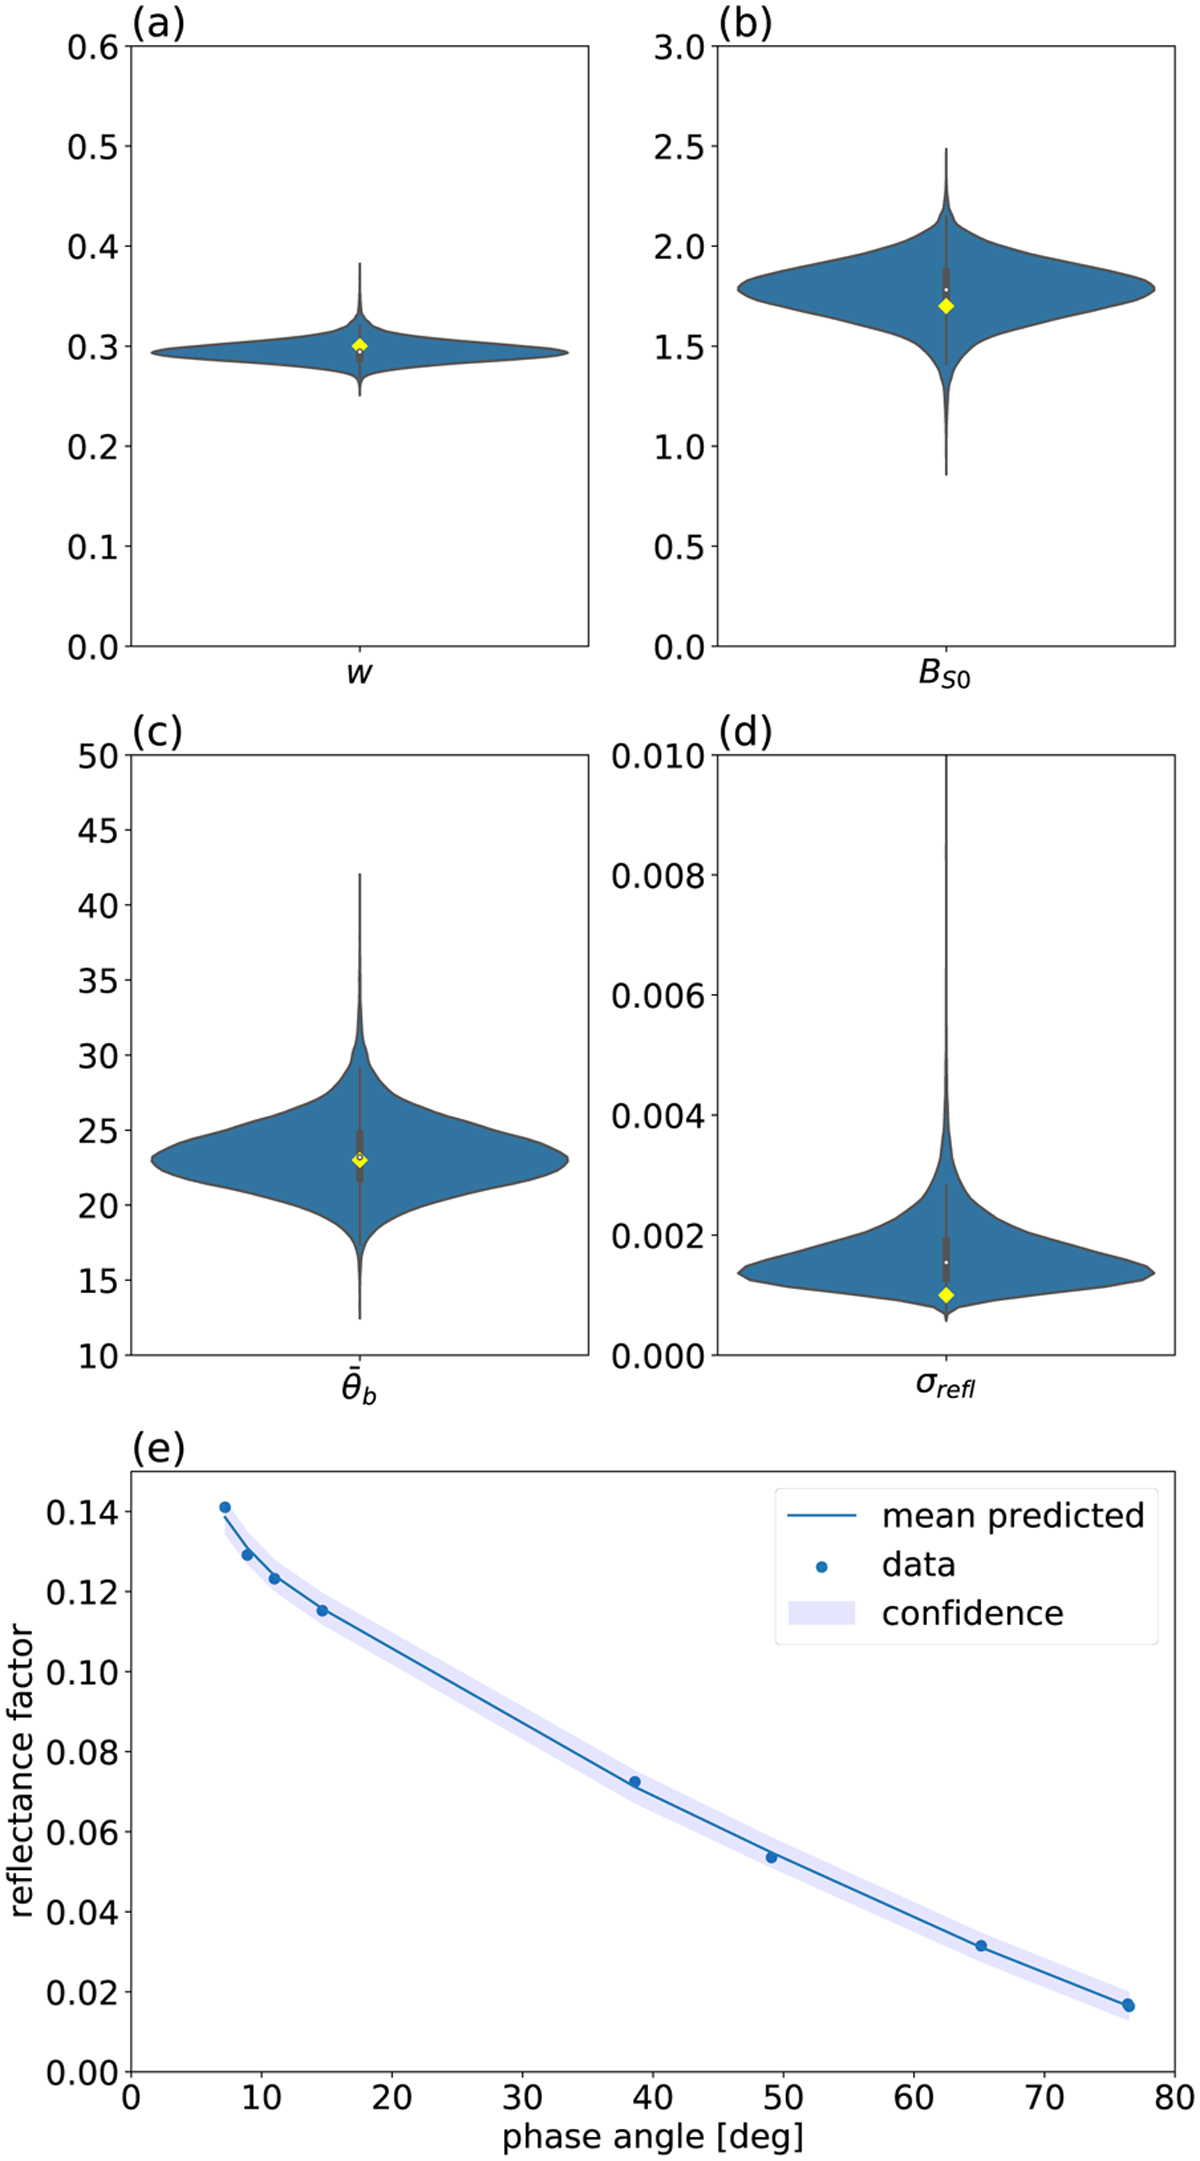
Posterior distributions (a−d) of the Hapke parameters for the same phase curve as in Fig. 4, when the parameters b and c of the phase function are set to 0.21 and 0.619, respectively. Panel (e) shows the confidence interval of the posterior predictive values.
Current usage metrics show cumulative count of Article Views (full-text article views including HTML views, PDF and ePub downloads, according to the available data) and Abstracts Views on Vision4Press platform.
Data correspond to usage on the plateform after 2015. The current usage metrics is available 48-96 hours after online publication and is updated daily on week days.
Initial download of the metrics may take a while.