Fig. 4
Download original image
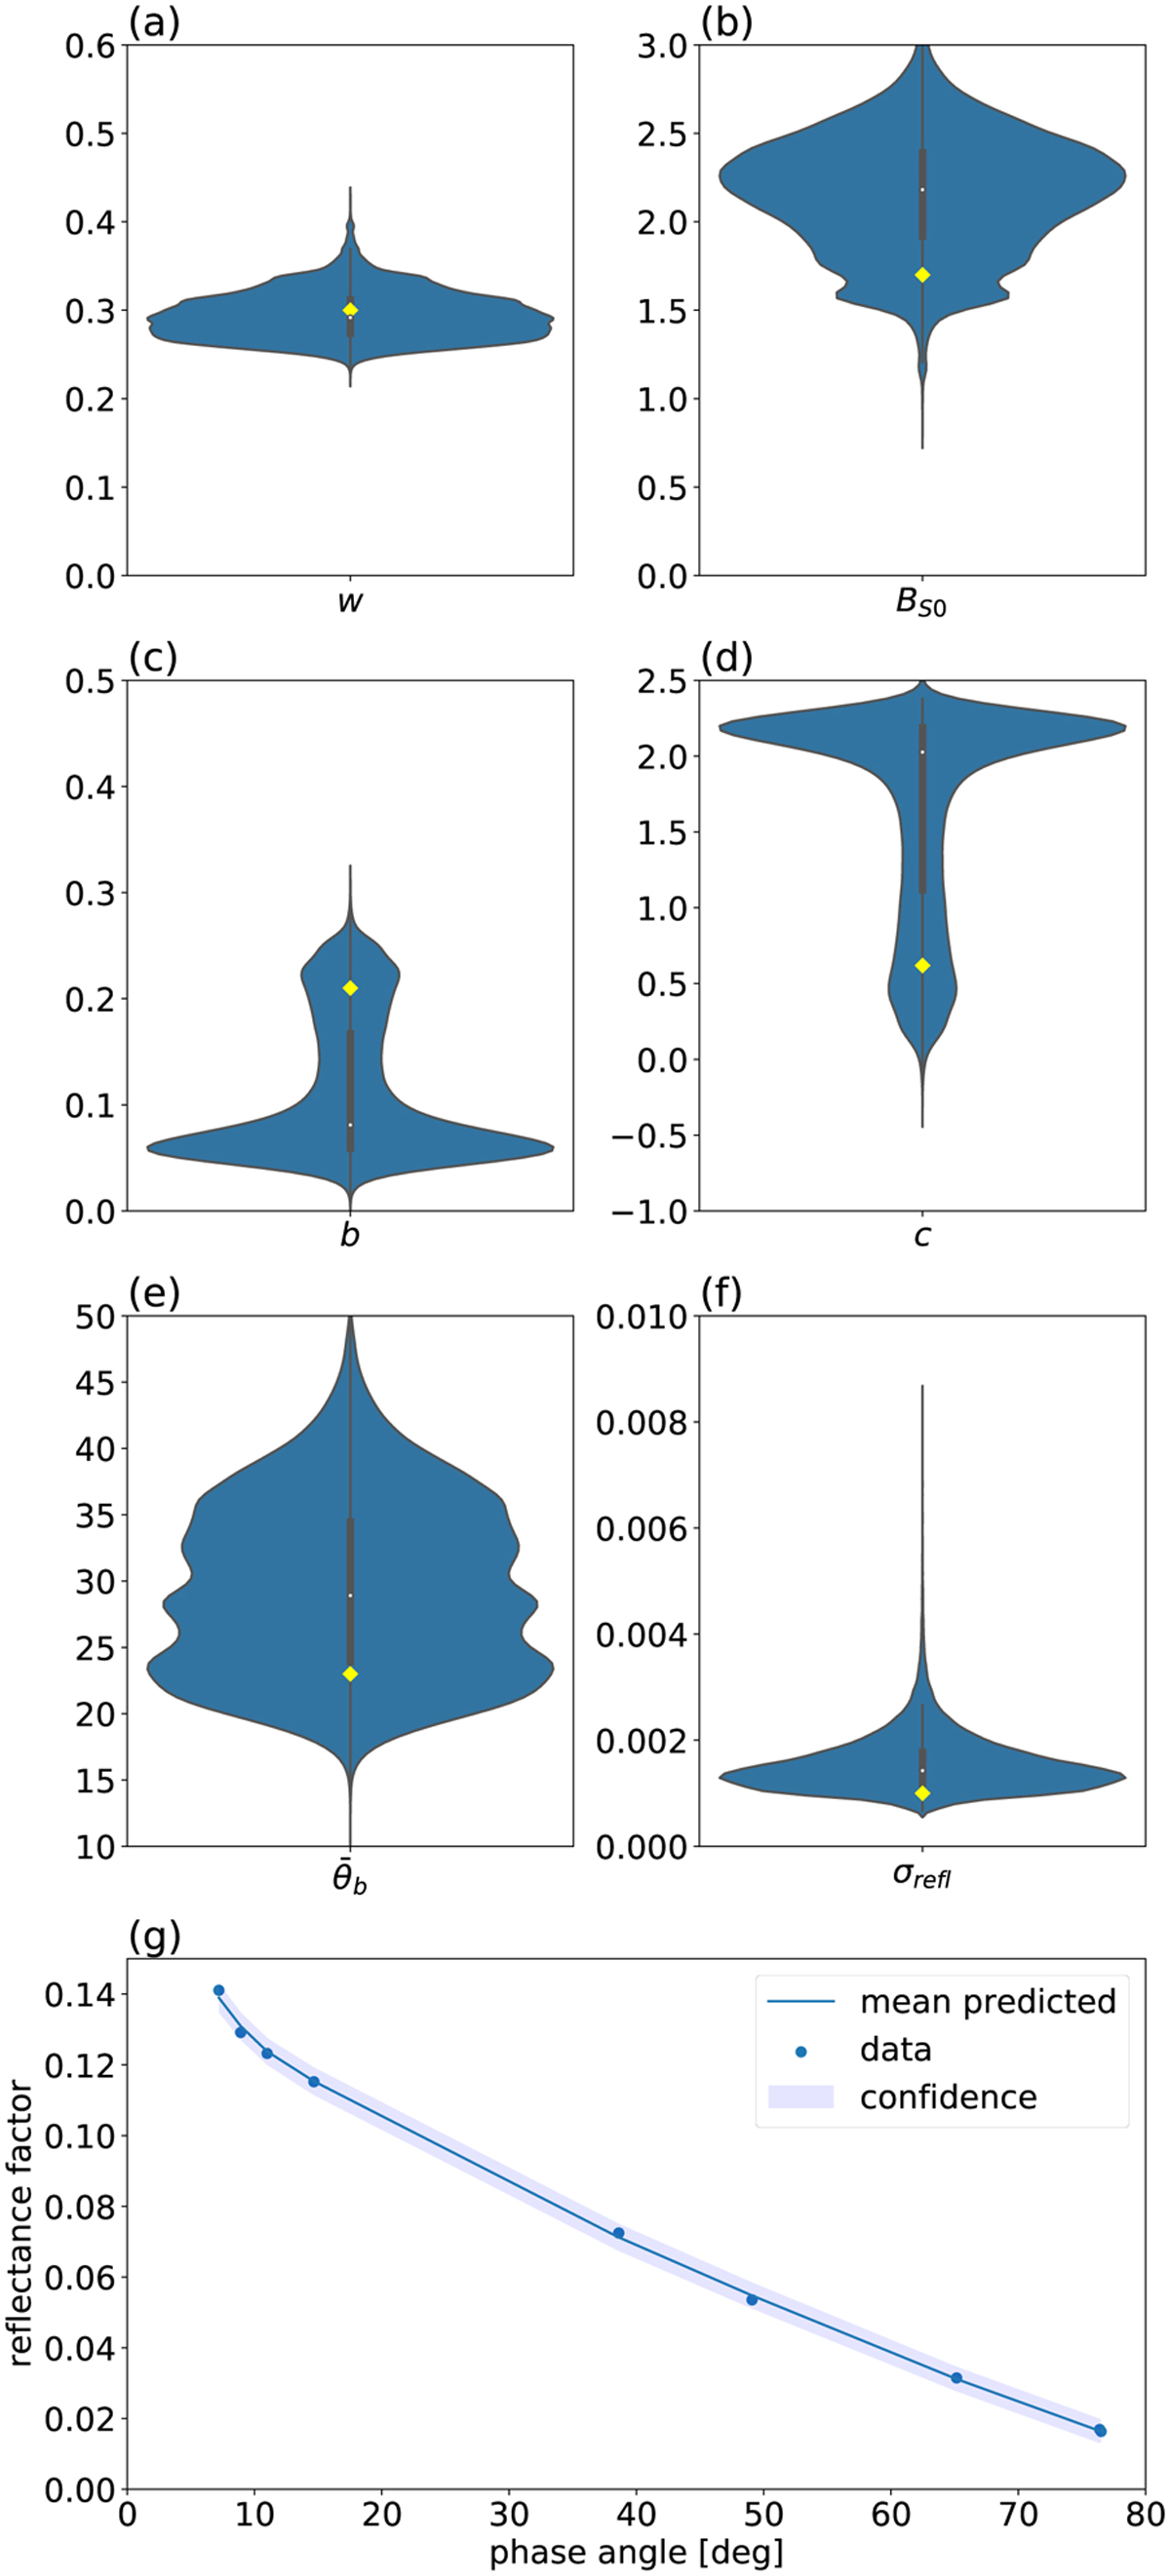
Posterior distribution (a−f) of Hapke parameters given the reflectance values for the average angles of the observations at the central oval of Reiner Gamma with additive gaussian noise with a standard deviation of σn = 0.001. Panel (g) shows the posterior predictive values with a mean and confidence interval, which represents the standard deviation of all accepted samples. Yellow diamonds mark the theoretical input values used to generate the phase curve.
Current usage metrics show cumulative count of Article Views (full-text article views including HTML views, PDF and ePub downloads, according to the available data) and Abstracts Views on Vision4Press platform.
Data correspond to usage on the plateform after 2015. The current usage metrics is available 48-96 hours after online publication and is updated daily on week days.
Initial download of the metrics may take a while.