Fig. 2
Download original image
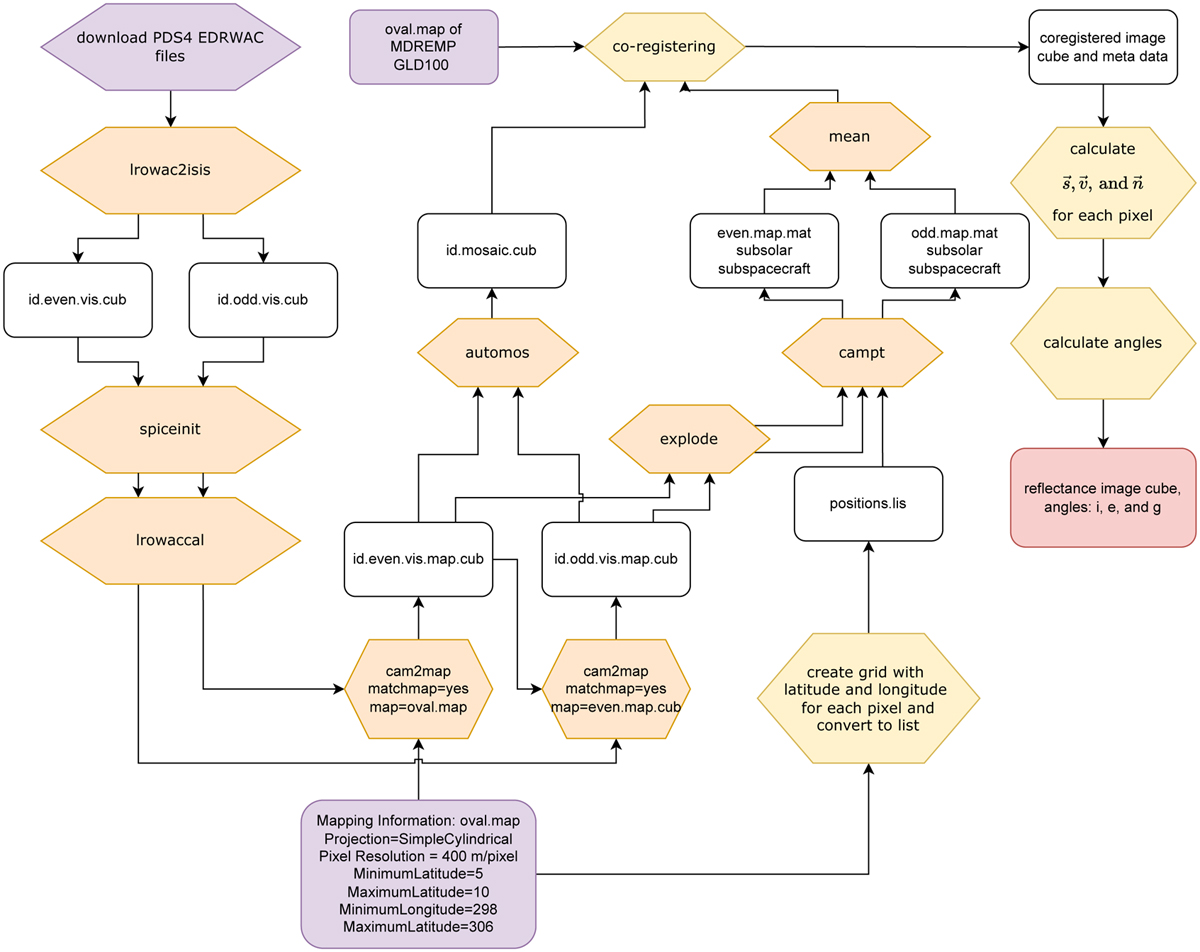
Pipeline to radiometrically calibrate and geo-reference WAC images. The output is an image where each pixel location is defined in the coordinate system of the global WAC mosaic and the GLD100 DTM, and the angles i, e, and g are given for each pixel are based on the SPICE kernels. Purple denotes external data input. Orange denotes steps carried out in ISIS. Yellow denotes steps implemented in MATLAB or Python.
Current usage metrics show cumulative count of Article Views (full-text article views including HTML views, PDF and ePub downloads, according to the available data) and Abstracts Views on Vision4Press platform.
Data correspond to usage on the plateform after 2015. The current usage metrics is available 48-96 hours after online publication and is updated daily on week days.
Initial download of the metrics may take a while.