Fig. 13
Download original image
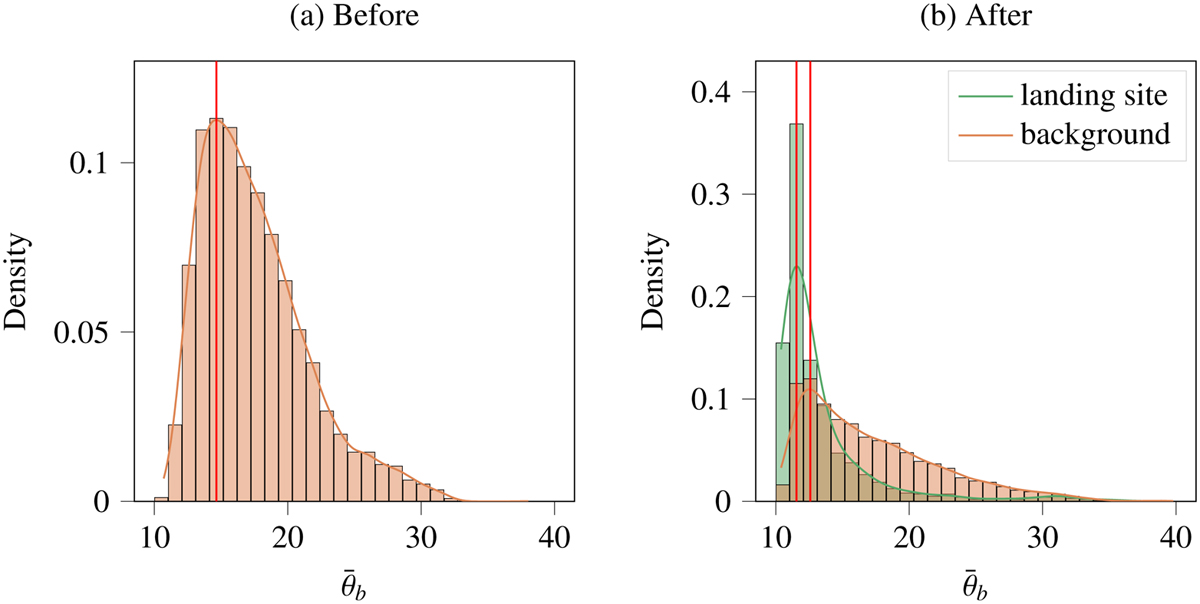
Histograms of the roughness angle ![]() in the region of interest (a) before and (b) after the landing. The modes of the histograms are indicated by the red vertical lines. Before the landing, the mode and mean of the background pixels are 14.7 and 17.5 degrees, respectively. Background: mode after the landing: 12.6 degrees; mean after the landing: 17.2 degrees. Landing site: mode after the landing: 11.6 degrees; mean after the landing: 13.4 degrees. The two distributions after the landing for the landing site and background have a KS-test score of D = 0.436 with p = 1.78 × 10⁻¹⁵.
in the region of interest (a) before and (b) after the landing. The modes of the histograms are indicated by the red vertical lines. Before the landing, the mode and mean of the background pixels are 14.7 and 17.5 degrees, respectively. Background: mode after the landing: 12.6 degrees; mean after the landing: 17.2 degrees. Landing site: mode after the landing: 11.6 degrees; mean after the landing: 13.4 degrees. The two distributions after the landing for the landing site and background have a KS-test score of D = 0.436 with p = 1.78 × 10⁻¹⁵.
Current usage metrics show cumulative count of Article Views (full-text article views including HTML views, PDF and ePub downloads, according to the available data) and Abstracts Views on Vision4Press platform.
Data correspond to usage on the plateform after 2015. The current usage metrics is available 48-96 hours after online publication and is updated daily on week days.
Initial download of the metrics may take a while.