Fig. 9.
Download original image
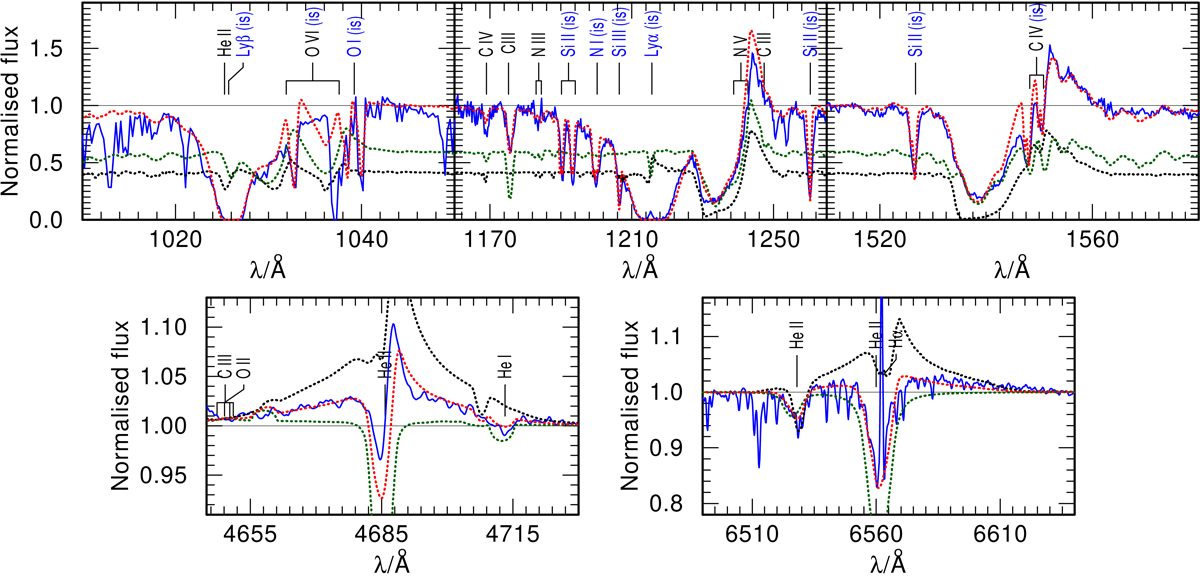
Close-ups on the key wind diagnostic lines (solid blue) in the FUV, UV and optical spectra overplotted by the combined synthetic model (dashed red). In the upper panels the weighted and in the lower panels the unweighted synthetic spectra of the primary and secondary components are shown as dotted black and green line, respectively. Upper left: the O VI line of the FUSE (ID 1) spectrum. This line is sensitive to X-rays. Upper middle: the N V resonance doublet in the HST FOS (ID 3) spectrum. Upper right: the C IV resonance doublet in the HST FOS (ID 3) spectrum. Lower left: the He IIλ 4686 line in the X-shooter spectrum (ID 9), showing strong wind emission features from the primary. Lower right: Hα of the X-shooter spectrum (ID 31), again, the primary dominates the wind emission of this line.
Current usage metrics show cumulative count of Article Views (full-text article views including HTML views, PDF and ePub downloads, according to the available data) and Abstracts Views on Vision4Press platform.
Data correspond to usage on the plateform after 2015. The current usage metrics is available 48-96 hours after online publication and is updated daily on week days.
Initial download of the metrics may take a while.