Fig. 10.
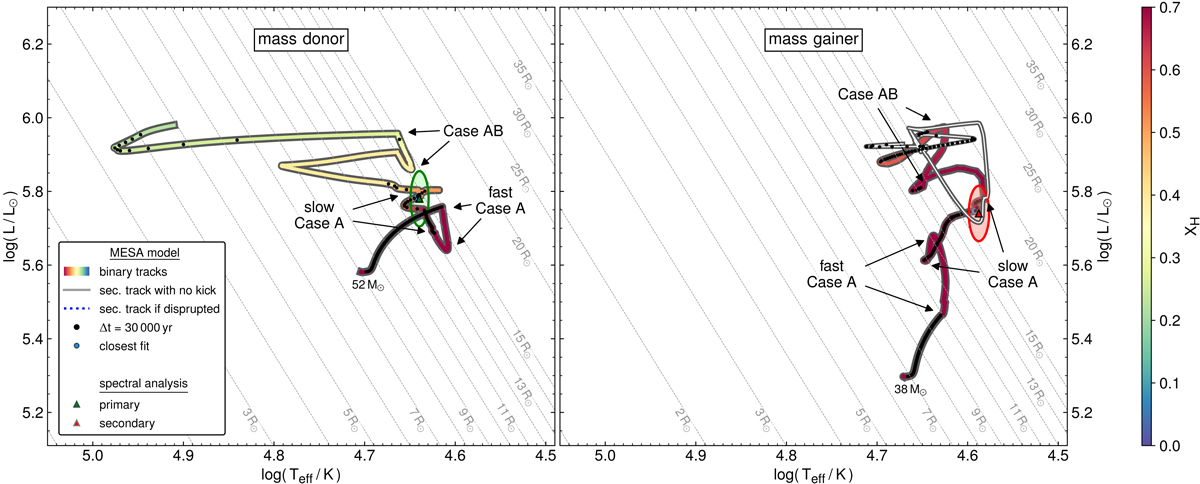
Download original image
Evolutionary tracks of the donor (left) and the accretor (right) colour-coded by their surface H-abundance. The track of the mass gainer is only colour-coded until the primary dies and then continues as a solid white line, assuming that the binary is not disrupted by a supernova explosion. The tracks are overlayed by black dots that show equidistant time steps of 30 000 yr to highlight phases in which the stars spend most of their time. The spectroscopic results are shown as green and red triangles surrounded by error ellipses. Start and end phases of fast and slow Case A, as well as Case AB mass-transfer are indicated by arrows. The iso-contours of equal radii are indicated in the background as dashed grey lines.
Current usage metrics show cumulative count of Article Views (full-text article views including HTML views, PDF and ePub downloads, according to the available data) and Abstracts Views on Vision4Press platform.
Data correspond to usage on the plateform after 2015. The current usage metrics is available 48-96 hours after online publication and is updated daily on week days.
Initial download of the metrics may take a while.