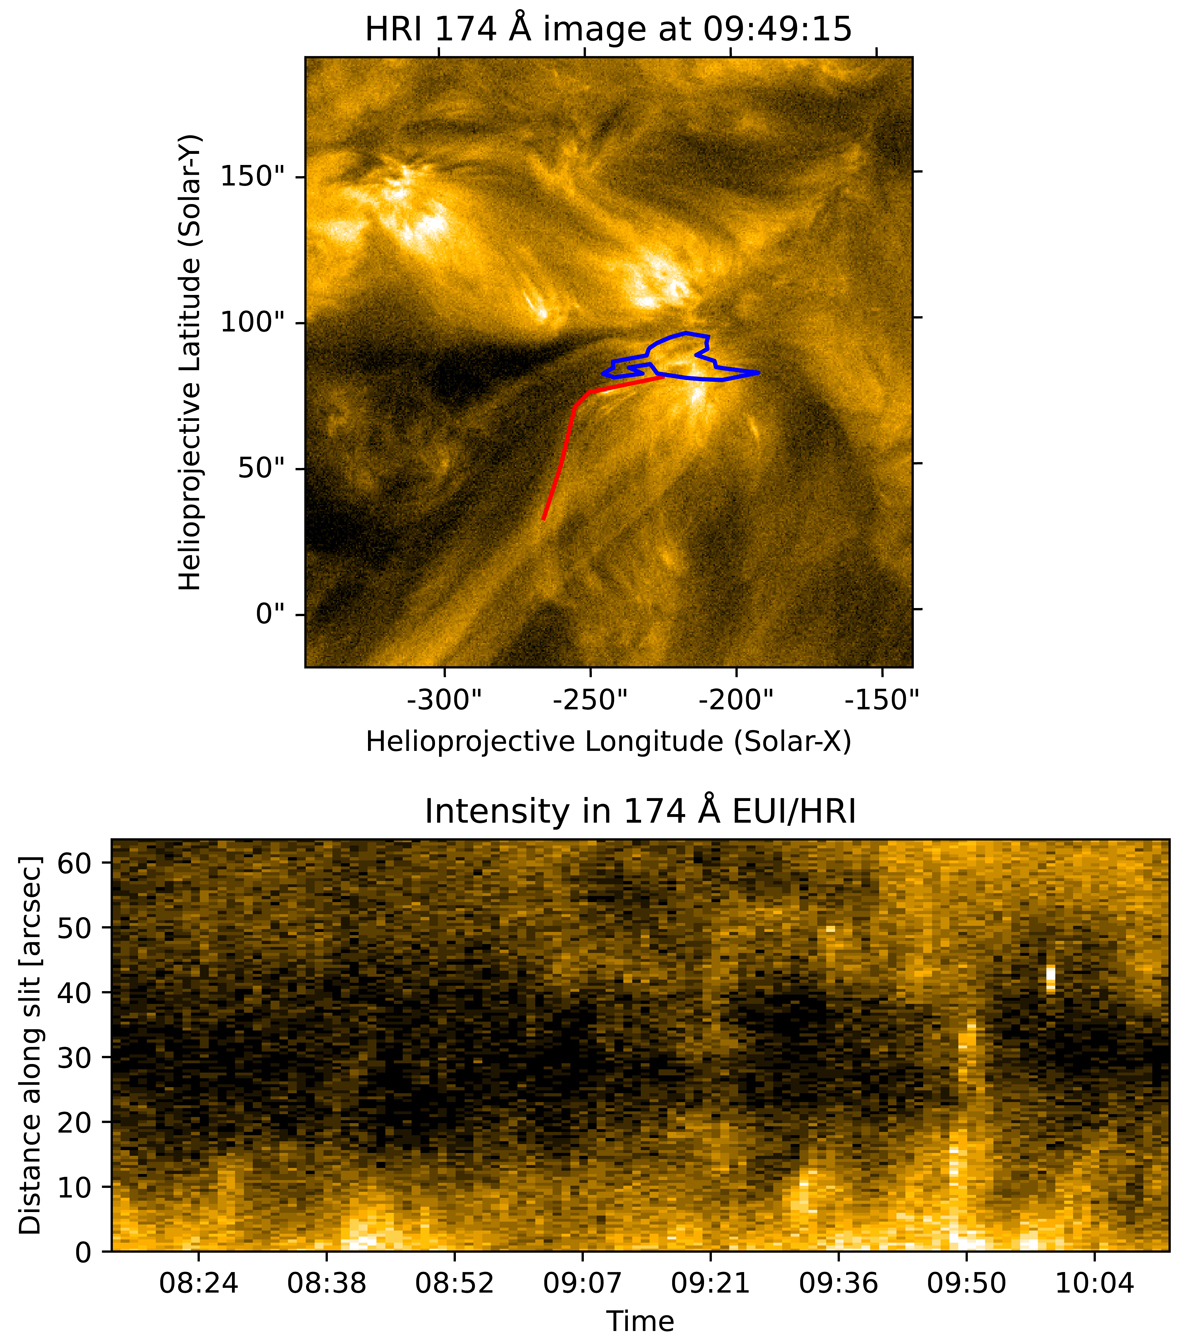
Fig. 7.

Download original image
Flows and brightenings measured along an artificial slit in HRIEUV. Upper panel: artificial slit (red line) used to measure the intensity over time along a medium-sized active loop to the south. Lower panel: intensity vs. time plot showing various types of activity along the loop. Brightenings that propagate along the loop are seen at 08:38 and 09:44 UT. Furthermore, a localised, non-propagating brightening is present at 09:56 UT.
Current usage metrics show cumulative count of Article Views (full-text article views including HTML views, PDF and ePub downloads, according to the available data) and Abstracts Views on Vision4Press platform.
Data correspond to usage on the plateform after 2015. The current usage metrics is available 48-96 hours after online publication and is updated daily on week days.
Initial download of the metrics may take a while.


