Fig. A.3
Download original image
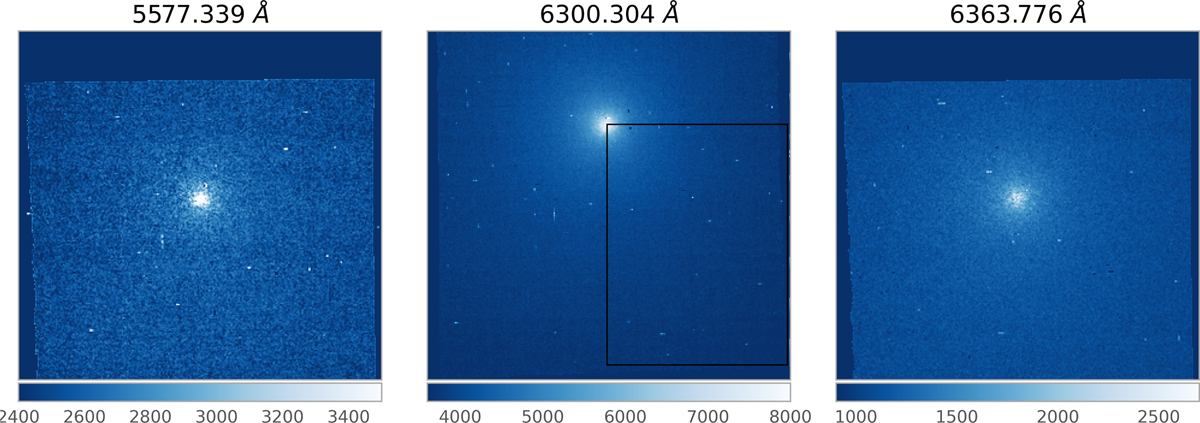
Maps of the three forbidden oxygen lines. The FoV is 60 × 58 ″2, and the images are oriented north up and east to the left. The 6300 Å line map is offset with respect to the other two maps since the spatial extension of the emission is larger, and only off-centered observations were used. The black box illustrates the aperture used for the measurement of the water production rate.
Current usage metrics show cumulative count of Article Views (full-text article views including HTML views, PDF and ePub downloads, according to the available data) and Abstracts Views on Vision4Press platform.
Data correspond to usage on the plateform after 2015. The current usage metrics is available 48-96 hours after online publication and is updated daily on week days.
Initial download of the metrics may take a while.