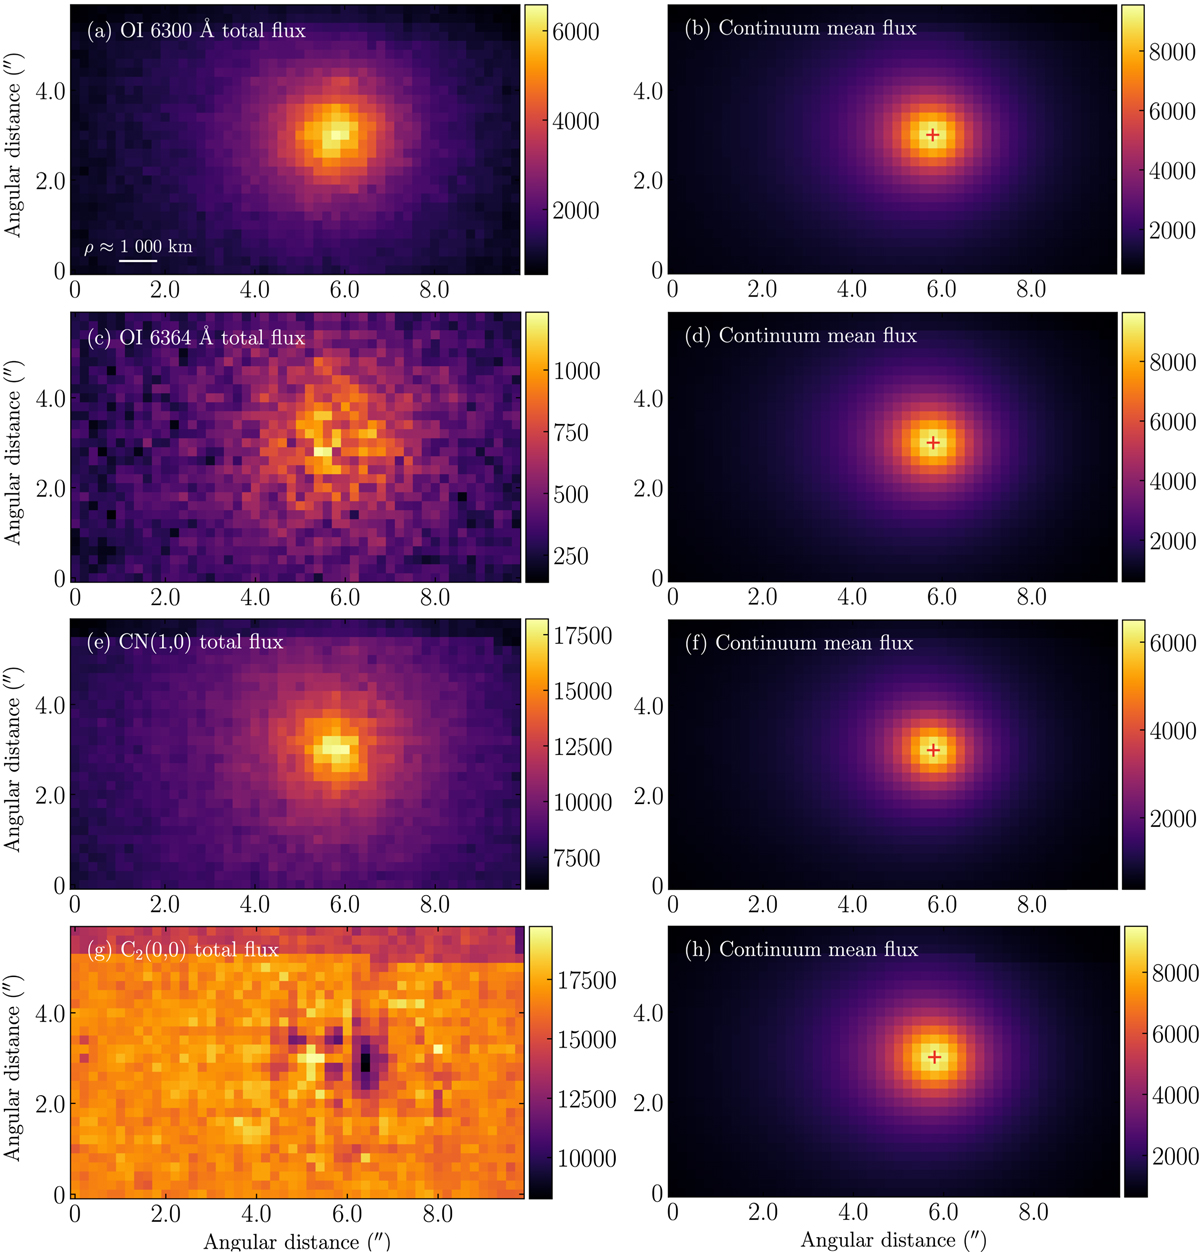
Fig. A.2
Download original image
Maps of four gas species isolated from Figure 5. Left: Unbinned flux distribution of each gas component highlighted in Figure 5b. All fluxes are in units of 10−20 erg cm−2 s−1. The flux drop of CN(1,0) red and C2(0,0) on the top part (panels e and g) is an artifact, likely due in part to their flux in the outer coma region highly susceptible to background noise, and thus having large uncertainties in estimating the continuum signal. Right: Unbinned flux distribution of the underlying continuum integrated over the considered wavelengths. They are subtracted from the observed spectrum to offer the line flux on the left side. The red plus sign (+) indicates the optocenter.
Current usage metrics show cumulative count of Article Views (full-text article views including HTML views, PDF and ePub downloads, according to the available data) and Abstracts Views on Vision4Press platform.
Data correspond to usage on the plateform after 2015. The current usage metrics is available 48-96 hours after online publication and is updated daily on week days.
Initial download of the metrics may take a while.