Fig. 5
Download original image
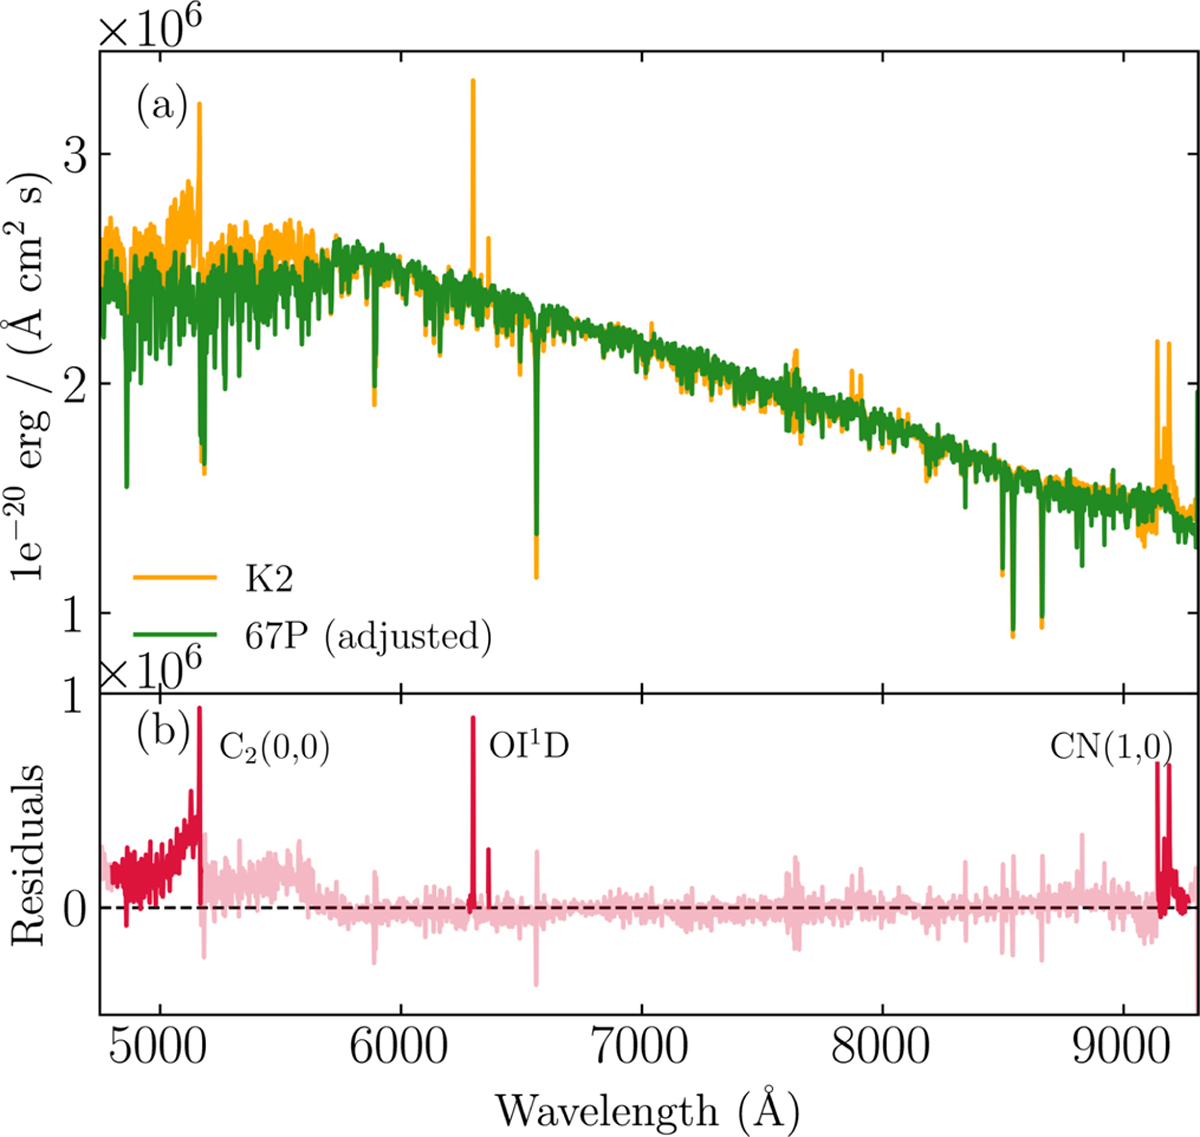
Procedure for isolating gas emission features from the observed spectrum, (a) Unbinned spectra of K2 (orange) and 67P/Churyumov-Gerasimenko (green, from Opitom et al. 2020) whose flux and slope are adjusted to those of K2. (b) Flux residuals after subtracting the adjusted 67P spectrum from the K2. Four emission features are highlighted by thick red lines whose flux and underlying continuum images are given in Fig. A.2. Although C2(1,0) at ~5500 Å is also marginally discernible, a flux map was not created for it in this study, due to its large uncertainty following continuum subtraction.
Current usage metrics show cumulative count of Article Views (full-text article views including HTML views, PDF and ePub downloads, according to the available data) and Abstracts Views on Vision4Press platform.
Data correspond to usage on the plateform after 2015. The current usage metrics is available 48-96 hours after online publication and is updated daily on week days.
Initial download of the metrics may take a while.