Fig. 4
Download original image
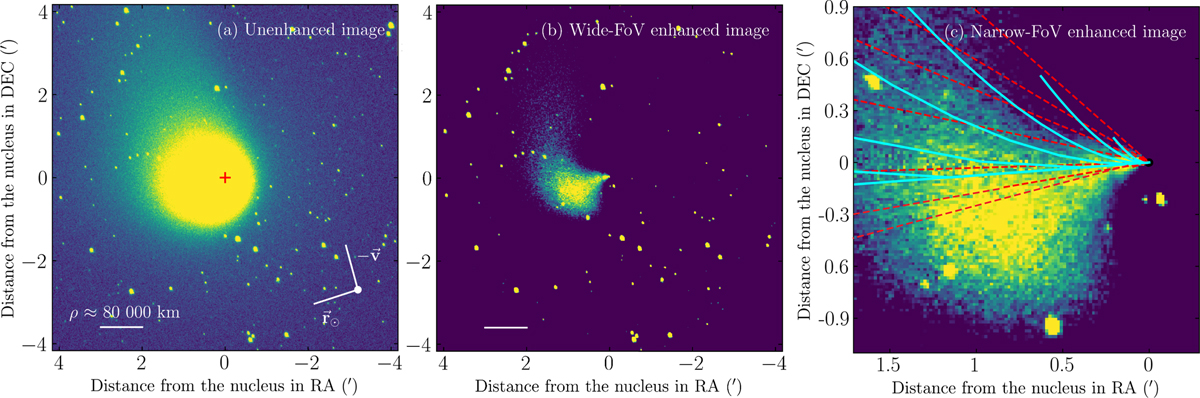
Analysis of K2 coma morphology using its ZTF zg-band archival image, (a) Unenhanced image of K2 on UT 2022 July 26, with the vector notation used in Fig. 3. The red plus sign (+) indicates the position of the nucleus as defined by the peak flux, (b) Image enhanced by dividing out of an azimuthal median profile (Samarasinha et al. 2013). (с) Synchrones and syndynes of the K2 coma. The red dashed lines are synchrones, indicating the locations of dust ejected at 1, 5, 15, 30, 60, 90, 120, and 180 days prior to the ZTF observation (from bottom to top). The cyan curves are syndynes, where each has a constant β of 1, 0.3, 0.1, 0.03, 0.01, 0.003, and 0.001 (clockwise from the bottom). A nonzero initial outflow velocity is required to explain dust spreading from south to southeast, which is not explained by the combination of dust parameters tested. Brightness levels were arbitrarily adjusted on a linear scale to highlight each image’s coma feature of interest.
Current usage metrics show cumulative count of Article Views (full-text article views including HTML views, PDF and ePub downloads, according to the available data) and Abstracts Views on Vision4Press platform.
Data correspond to usage on the plateform after 2015. The current usage metrics is available 48-96 hours after online publication and is updated daily on week days.
Initial download of the metrics may take a while.