Fig. 6.
Download original image
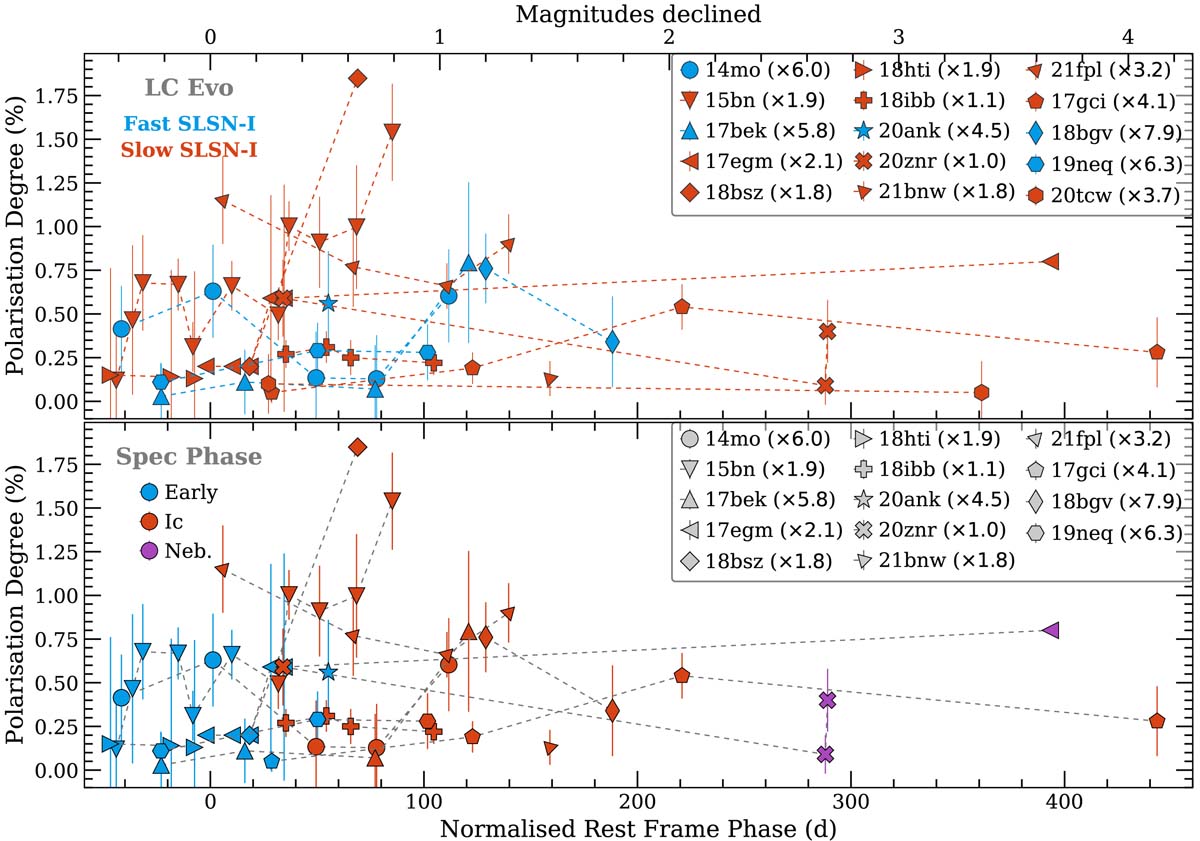
Polarisation degree vs. the normalised rest frame phase for SLSNe-I with polarimetric data highlighting the diverse decline rates (top) and spectroscopic phase of each epoch of polarimetry (bottom). The stretch factors used to normalise the decline rates are shown in the legend. The top axis refers to the number of magnitudes declined by the SNe based on the linear fits. Only slowly evolving SLSNe-I have shown non-zero P, but the Fast ones have not been observed sufficiently late on in their evolution to rule it out. Spectroscopically, the SLSNe-I exhibit low polarisation during the Early phase, but no relation to polarimetry can be identified at the later phases. We note that SN 2018ffj is not shown due to the unconstrained peak time and SN 2020tcw is not shown in the bottom panel due to uncertain spectroscopic phases during the polarimetric epochs.
Current usage metrics show cumulative count of Article Views (full-text article views including HTML views, PDF and ePub downloads, according to the available data) and Abstracts Views on Vision4Press platform.
Data correspond to usage on the plateform after 2015. The current usage metrics is available 48-96 hours after online publication and is updated daily on week days.
Initial download of the metrics may take a while.