Fig. 5.
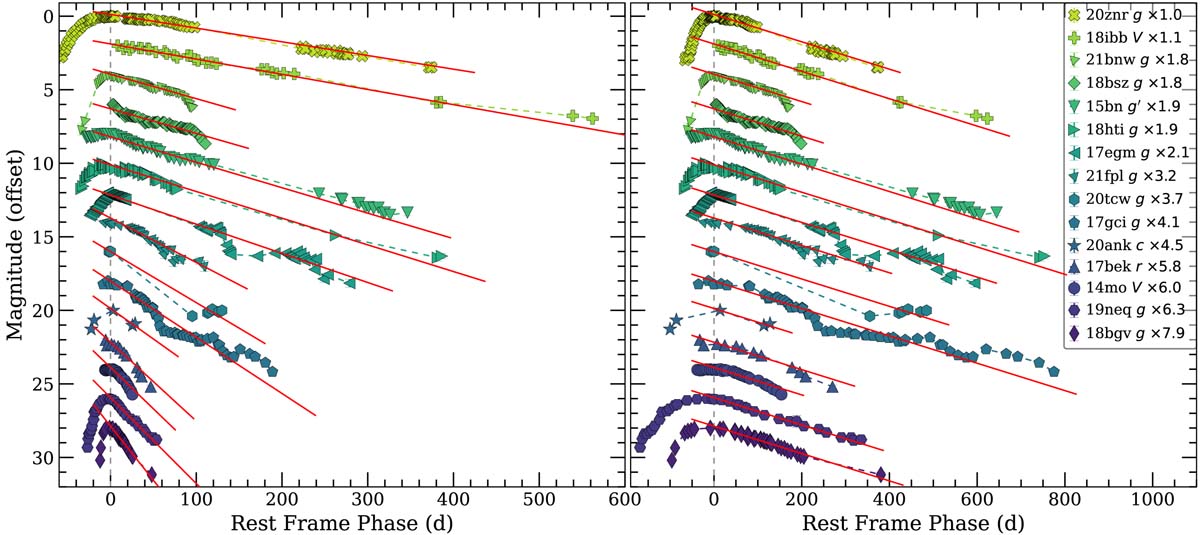
Download original image
Light curves used to estimate the decline rates (left) and the light curves stretched to the decline rate of SN 2020znr (right). The light curves are offset and the SNe are shown in the order from slow to fast for visual clarity. The multiplication factors used are given in the legend. The linear fits are shown with red lines. Only the data points after the dashed vertical grey line are used for the fits. We note that SN 2018ffj is excluded due to an uncertain peak epoch. The light curves are collected from the following sources: SN 2020znr, SN 2021fpl, SN 2020tcw, and SN 2019neq from ZTF via the Alerce broker (Förster et al. 2021), and SN 2018ibb (Schulze et al. 2023), SN 2018bsz (Chen et al. 2021), SN 2015bn (Nicholl et al. 2016b,a), SN 2018hti (Fiore et al. 2022), SN 2017egm (Bose et al. 2018; Hosseinzadeh et al. 2021), SN 2017gci (Fiore et al. 2021), SN 2020ank from ATLAS (Tonry et al. 2018), LSQ14mo (Leloudas et al. 2015a), SN2018bgv (Lunnan et al. 2020).
Current usage metrics show cumulative count of Article Views (full-text article views including HTML views, PDF and ePub downloads, according to the available data) and Abstracts Views on Vision4Press platform.
Data correspond to usage on the plateform after 2015. The current usage metrics is available 48-96 hours after online publication and is updated daily on week days.
Initial download of the metrics may take a while.