Fig. 3.
Download original image
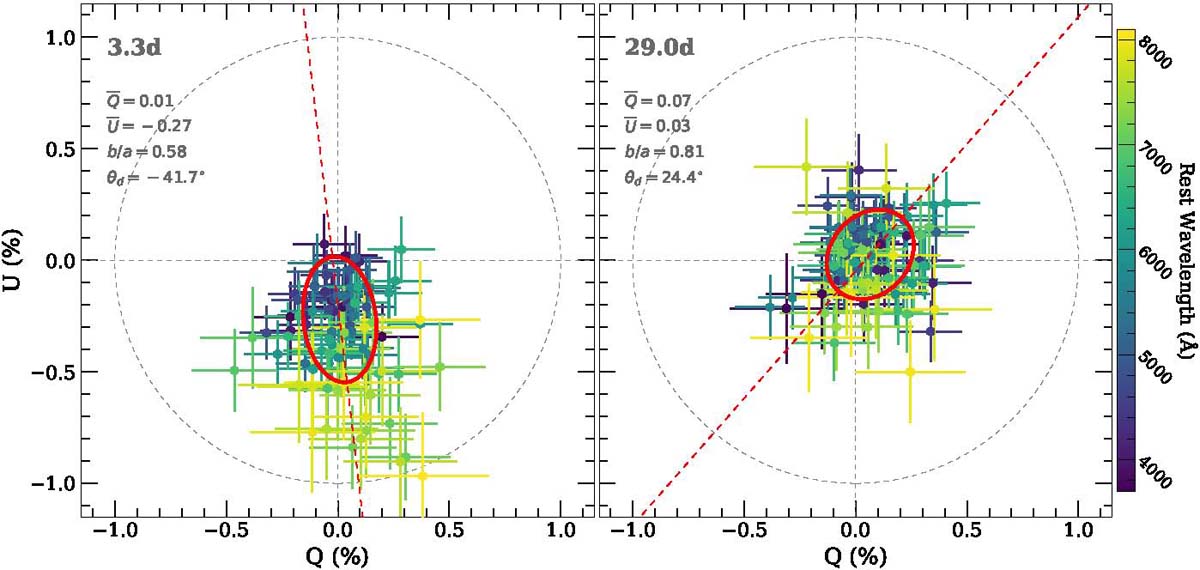
Q – U planes for the ISP-corrected spectropolarimetry of SN 2017gci at +3.3 d (left) and +29.0 d (right). The data colours follow wavelengths as indicated by the colour bar and the dashed grey lines mark Q = 0, U = 0, and P = 1. The red ellipses drawn at the barycentre of the data (![]() ,
, ![]() ) are based on a principal component analysis (Maund et al. 2010) and quantify the direction of the maximum variance of the polarisation (major axis) and the ratio of polarisation toward the orthogonal direction (the minor-to-major axis ratio b/a). The dominant axis (dashed red line) is drawn along the semi-major axis of the ellipse at an angle θd as measured from north towards east on the sky. At the first epoch, the data appear to follow the dominant axis within the observational noise, but at the second epoch the points are clustered roughly circularly around P = 0 with a weaker tendency along the drawn dominant axis.
) are based on a principal component analysis (Maund et al. 2010) and quantify the direction of the maximum variance of the polarisation (major axis) and the ratio of polarisation toward the orthogonal direction (the minor-to-major axis ratio b/a). The dominant axis (dashed red line) is drawn along the semi-major axis of the ellipse at an angle θd as measured from north towards east on the sky. At the first epoch, the data appear to follow the dominant axis within the observational noise, but at the second epoch the points are clustered roughly circularly around P = 0 with a weaker tendency along the drawn dominant axis.
Current usage metrics show cumulative count of Article Views (full-text article views including HTML views, PDF and ePub downloads, according to the available data) and Abstracts Views on Vision4Press platform.
Data correspond to usage on the plateform after 2015. The current usage metrics is available 48-96 hours after online publication and is updated daily on week days.
Initial download of the metrics may take a while.