Open Access
Fig. 2
Download original image
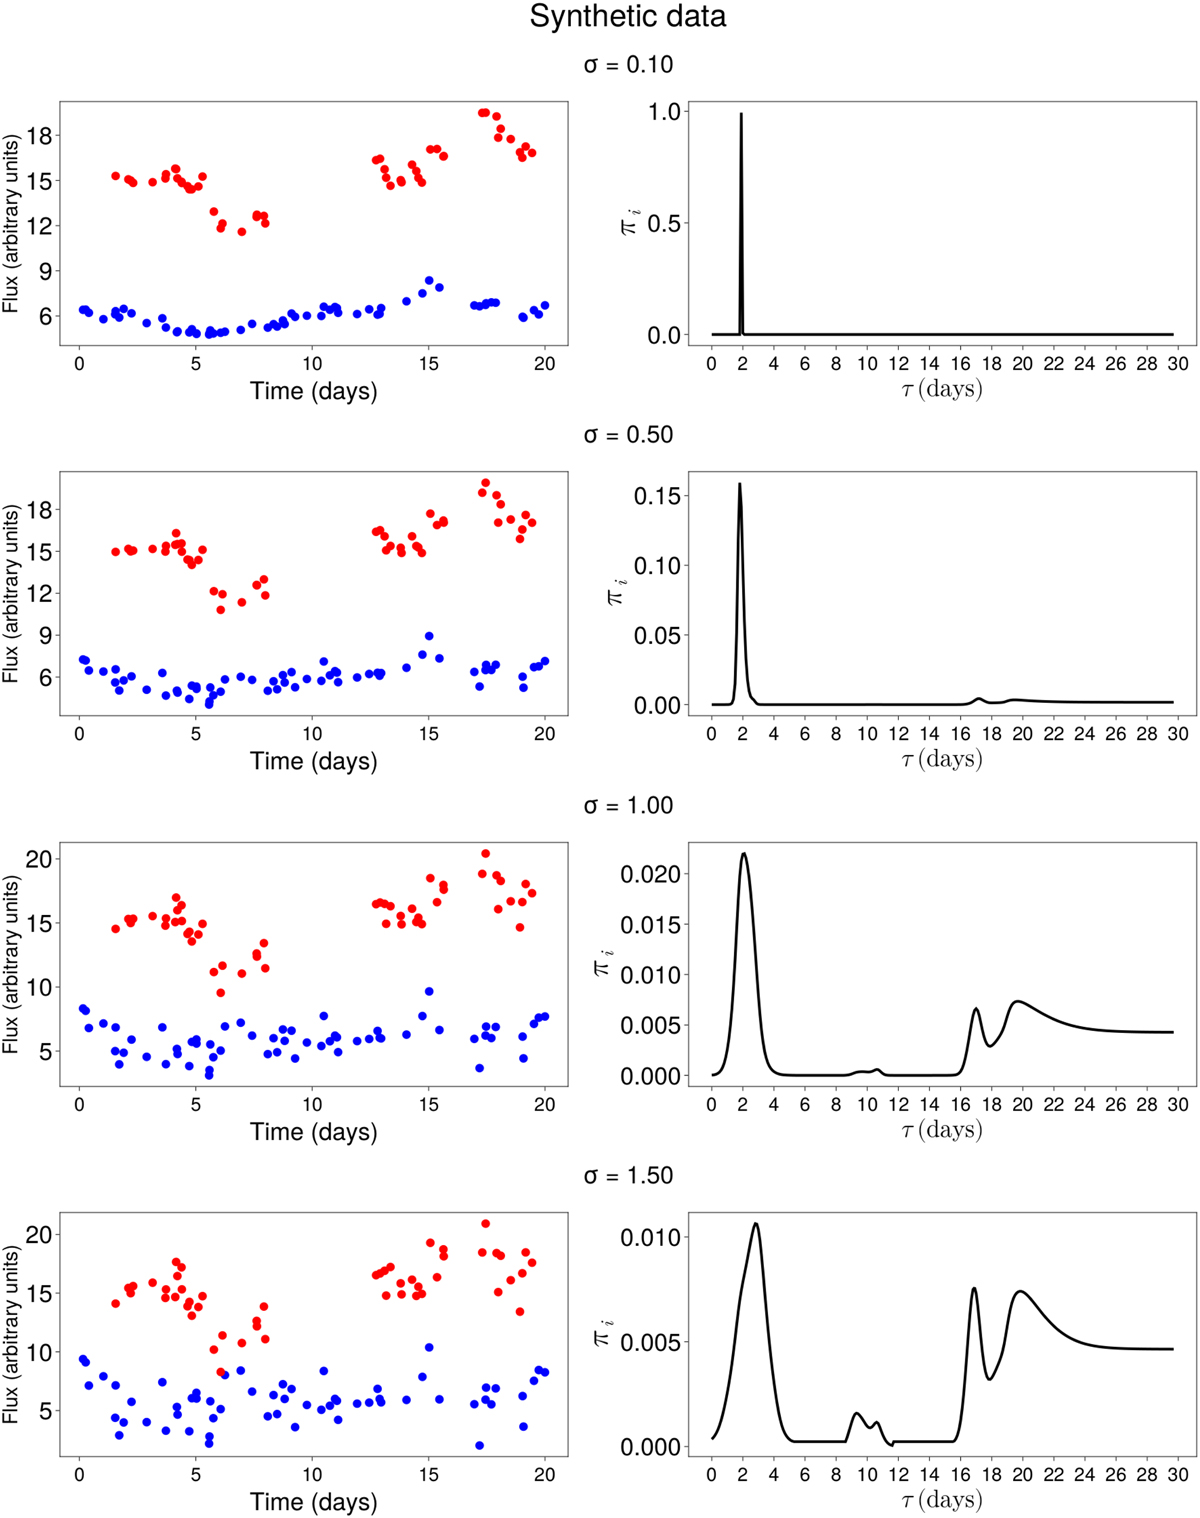
Synthetic simulations with true delay at 2 days. The vertical axis is in arbitrary units of simulated flux. The left column shows the simulated light curves. The inferred posterior distribution of delay is shown in the right column. The noise σ increases from the top to the bottom row.
Current usage metrics show cumulative count of Article Views (full-text article views including HTML views, PDF and ePub downloads, according to the available data) and Abstracts Views on Vision4Press platform.
Data correspond to usage on the plateform after 2015. The current usage metrics is available 48-96 hours after online publication and is updated daily on week days.
Initial download of the metrics may take a while.