Fig. C.1
Download original image
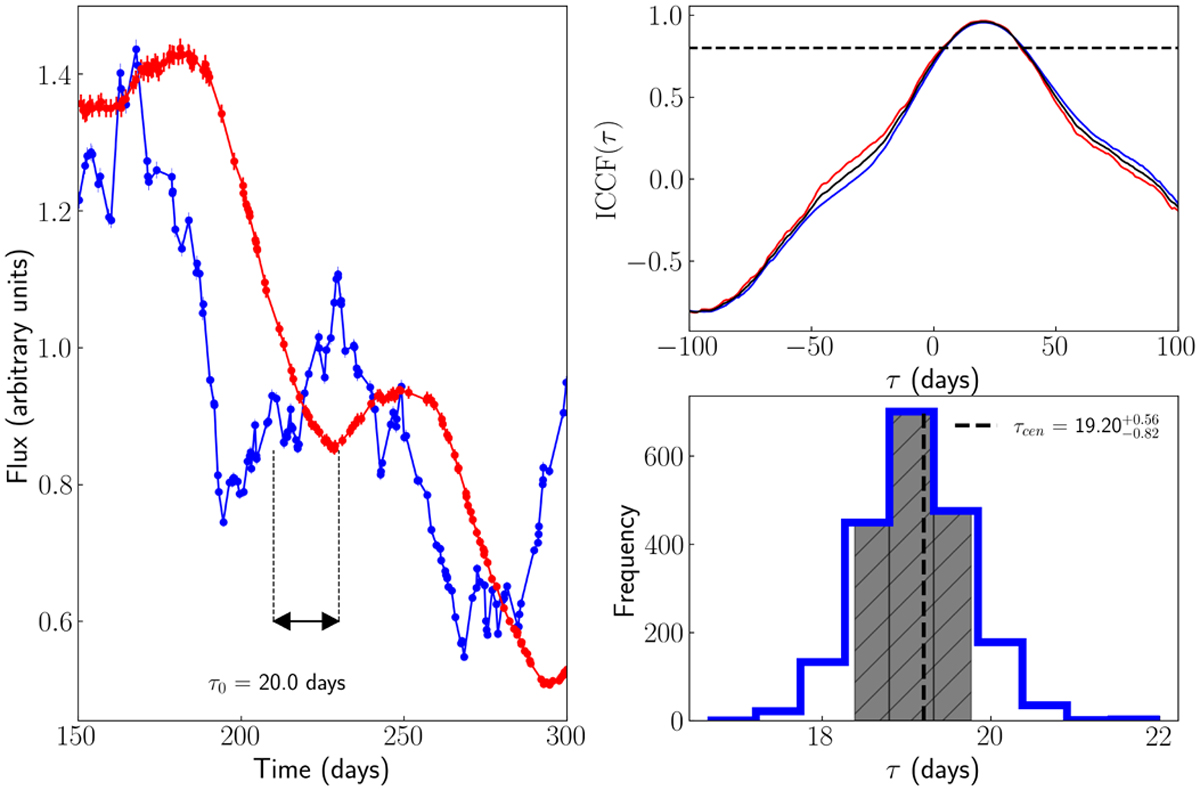
ICCF application to simulated data. Left panel: AD continuum light curve (blue) modelled as a random walk process with a power spectral density P(ν) ∝ ν−2 (Kelly et al. 2009; Caplar et al. 2017). The delayed BLR emission line light curve (red) is obtained by convolving the AD light curve with a rectangular transfer function over the time domain, t ∈[τ0 − ∆τ/2, τ0 + ∆τ/2] where ∆τ/τ0 ≤ 2 (Pozo Nuñez et al. 2013). For this particular example, a centroid τ0 = 20 days is assumed. Both light curves were randomly sampled, with an average sampling of 1 day and noise level of 1% (S/N = 100). Right Upper Panel: ICCF results when the line is interpolated and the continuum is shifted (blue) and when the continuum is interpolated and the line is shifted (red). The average ICCF is shown in black. The dotted black line marks the threshold of 0.8max(ICCF) used to calculate the centroid. Right bottom panel: The histogram shows the distribution of the centroid delay obtained by the FR/RSS method (see text). The black area marks the 68% confidence range used to calculate the errors of the centroid.
Current usage metrics show cumulative count of Article Views (full-text article views including HTML views, PDF and ePub downloads, according to the available data) and Abstracts Views on Vision4Press platform.
Data correspond to usage on the plateform after 2015. The current usage metrics is available 48-96 hours after online publication and is updated daily on week days.
Initial download of the metrics may take a while.