Fig. 5.
Download original image
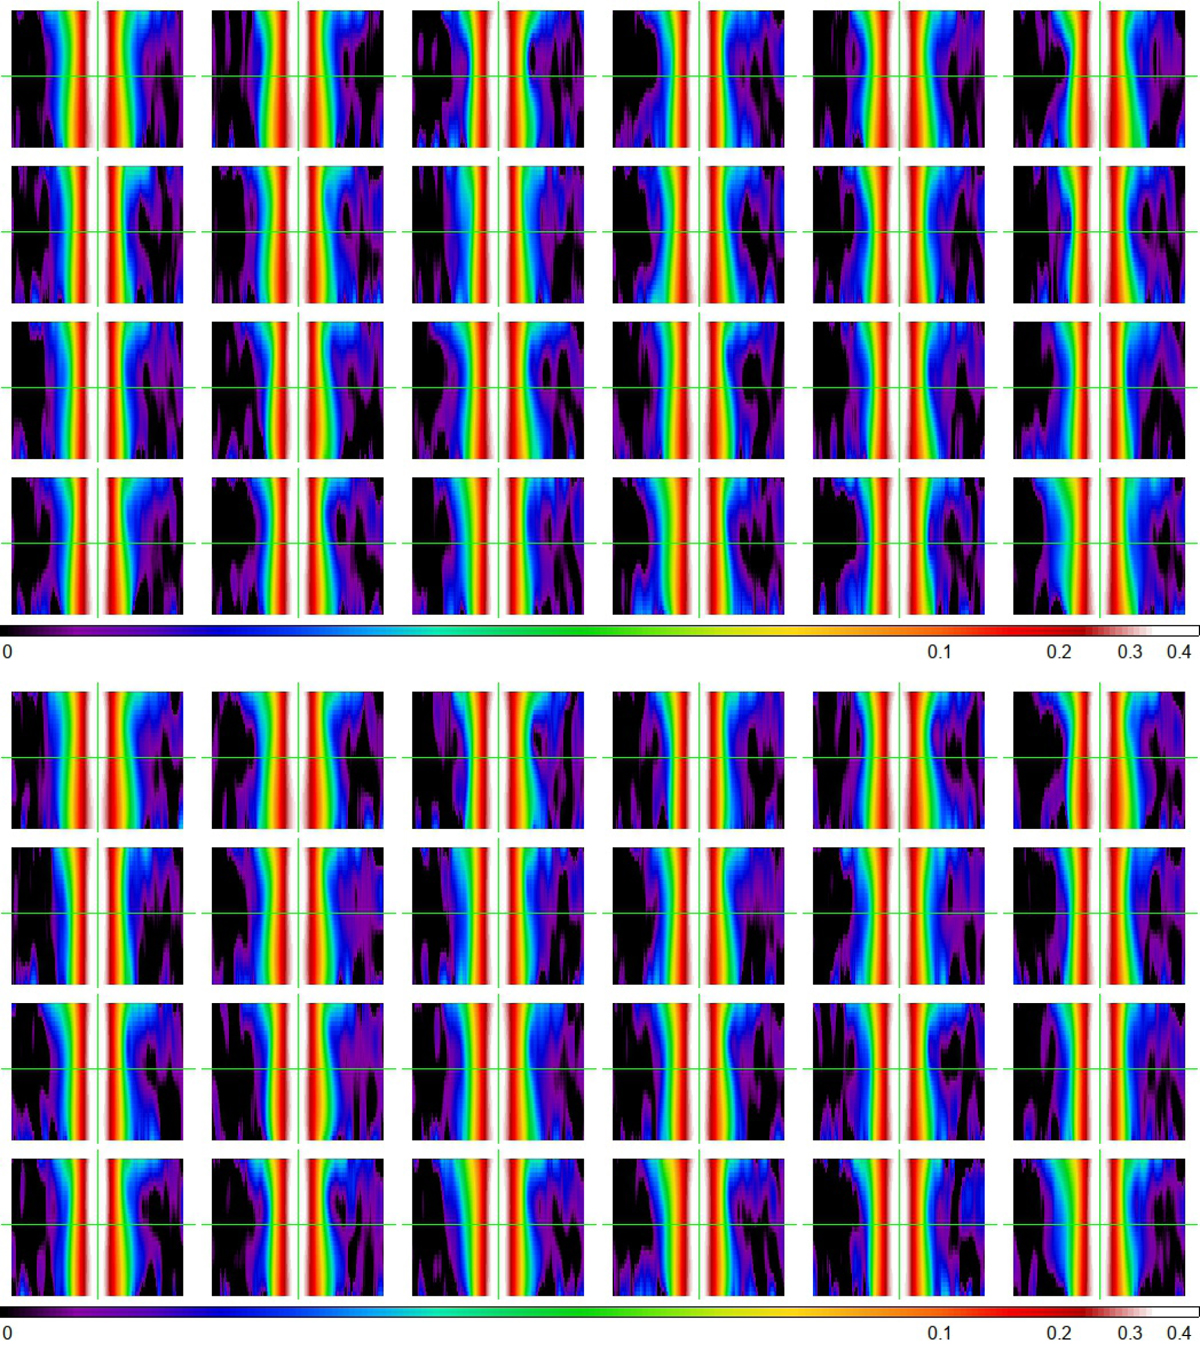
LSF derived from arc lines for two slices (top: slice 20, bottom: slice 23) in all 24 MUSE spectrographs. Each of the 24 panels shows the profile for the given slice in one IFU, with the line wavelength increasing vertically from 4650 to 9300 Å. The normalised line profile at each wavelength is distributed horizontally, ±7.5 Å from the line centre.
Current usage metrics show cumulative count of Article Views (full-text article views including HTML views, PDF and ePub downloads, according to the available data) and Abstracts Views on Vision4Press platform.
Data correspond to usage on the plateform after 2015. The current usage metrics is available 48-96 hours after online publication and is updated daily on week days.
Initial download of the metrics may take a while.