Fig. 4.
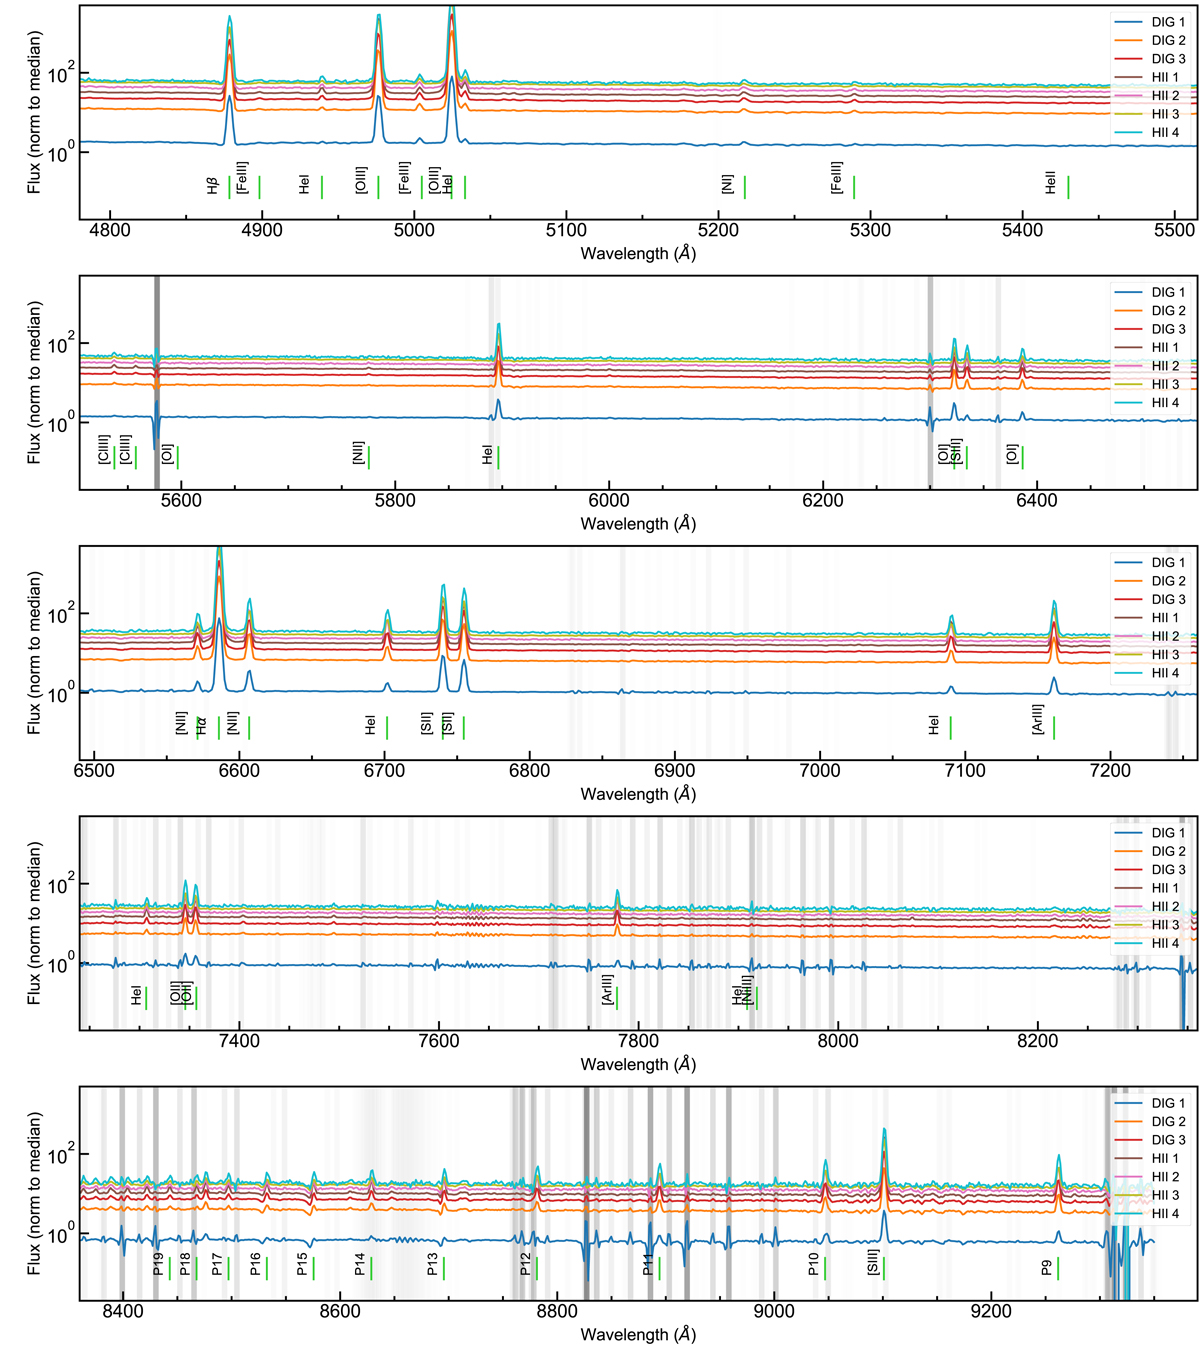
Download original image
Integrated spectra for the regions defined by astrodendro. Fluxes are presented in logarithmic stretch to optimally visualise at the same time bright and faint features. Spectra have been offset by a factor ×(1 + 2 N) with N the spectrum number, as indicated by the alphabetically ordering of the labels, to avoid an overlap of the spectra. Small vertical limegreen lines indicate the expected position of the relevant emission lines. The vertical grey bands mark the position of the brightest skylines, the stronger the line is, the more opaque the band appears.
Current usage metrics show cumulative count of Article Views (full-text article views including HTML views, PDF and ePub downloads, according to the available data) and Abstracts Views on Vision4Press platform.
Data correspond to usage on the plateform after 2015. The current usage metrics is available 48-96 hours after online publication and is updated daily on week days.
Initial download of the metrics may take a while.