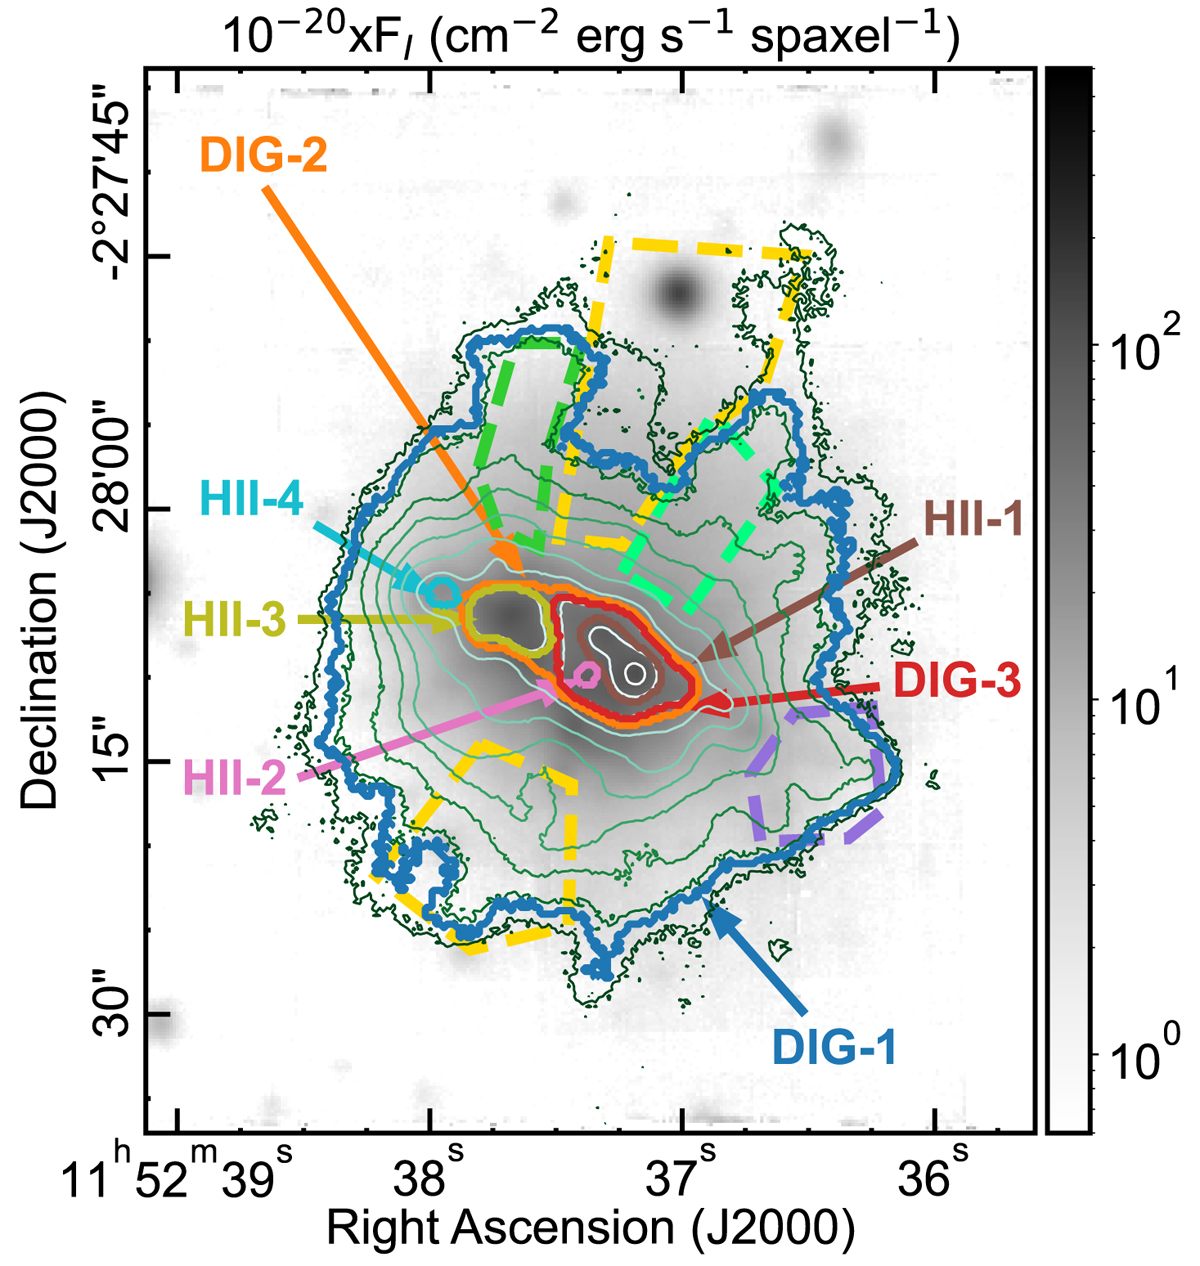
Fig. 3.
Download original image
Reconstructed image of UM 462 made by simulating the action of a broad filter in the I band with contours showing the ‘leaves’ and ‘branches’ according to the hierarchical clustering provided by astrodendro. Besides, several polygons in dashed lines mark the location of structures within the galaxy of particular interest in terms of ionisation or kinematics. A map in Hα flux made by line fitting on a spaxel-by-spaxel basis is overplotted with ten evenly spaced contours (in logarithmic scale) ranging from 1.26 × 10⁻¹⁸ erg cm−2 s−1 spaxel−1 to 1.26 × 10⁻¹⁵ erg cm−2 s−1 spaxel−1.
Current usage metrics show cumulative count of Article Views (full-text article views including HTML views, PDF and ePub downloads, according to the available data) and Abstracts Views on Vision4Press platform.
Data correspond to usage on the plateform after 2015. The current usage metrics is available 48-96 hours after online publication and is updated daily on week days.
Initial download of the metrics may take a while.