Fig. 24.
Download original image
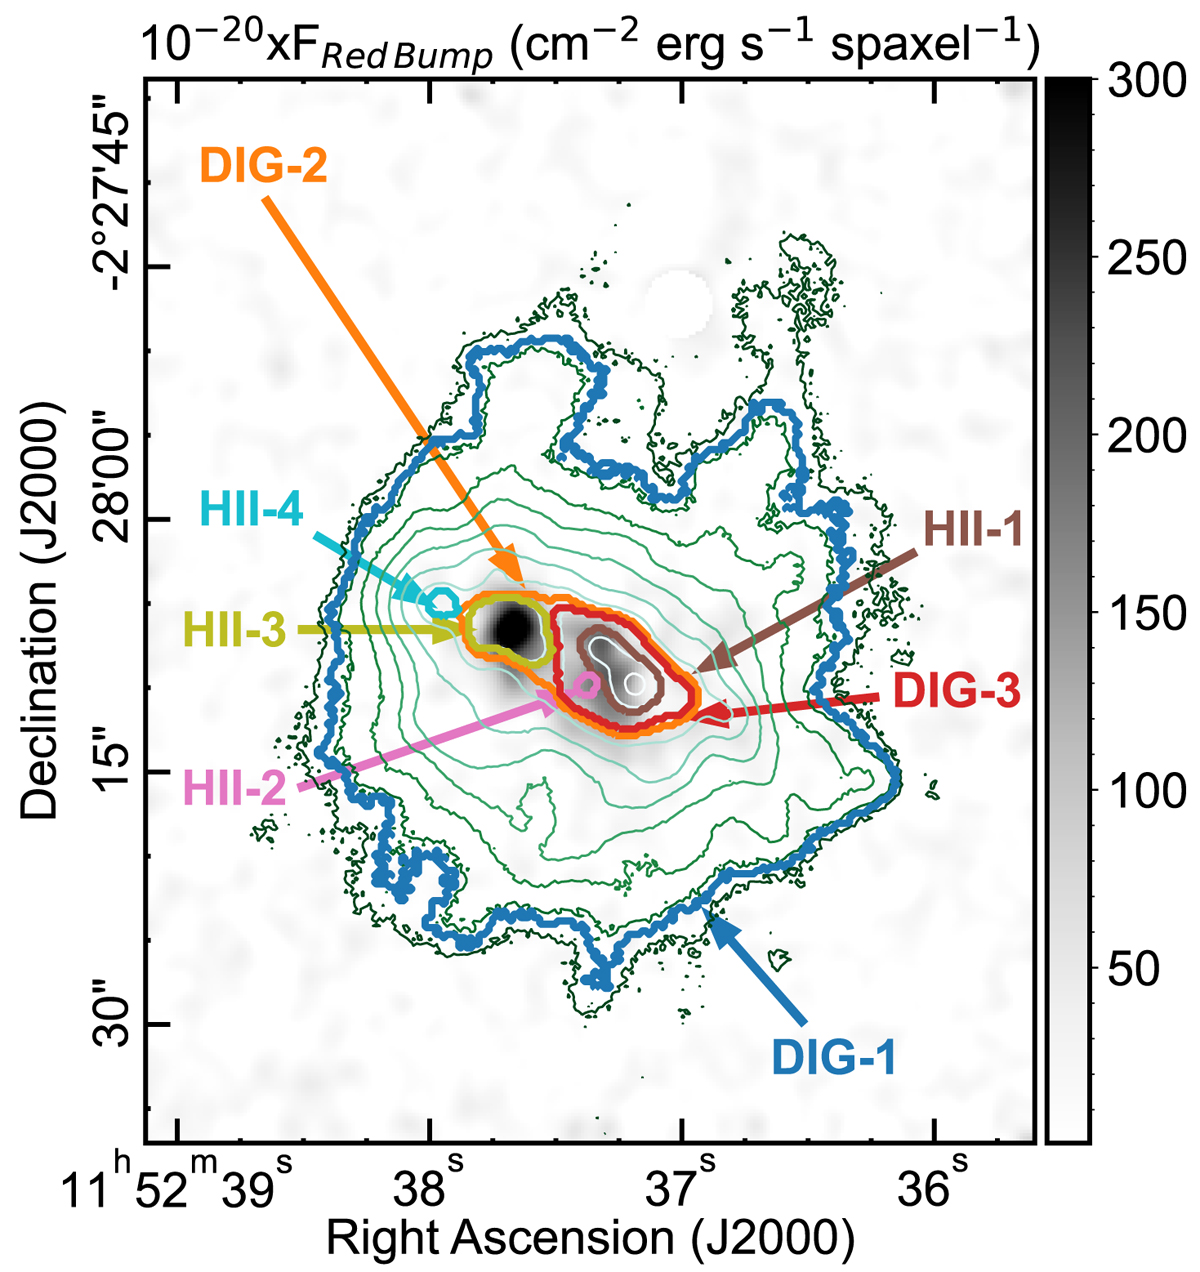
Map showing the location with excess of emission at the wavelengths corresponding to the red bump (5760 − 5860 Å, rest-frame). For reference, the map in Hα flux made by line fitting on a spaxel-by-spaxel basis is overplotted with ten evenly spaced contours (in logarithmic scale) ranging from 1.26 × 10⁻¹⁸ erg cm−2 s−1 spaxel−1 to 1.26 × 10⁻¹⁵ erg cm−2 s−1 spaxel−1. Likewise, the different regions and areas discussed along the work are marked with the same colour and line code as in Fig. 3. North is up and east towards the left.
Current usage metrics show cumulative count of Article Views (full-text article views including HTML views, PDF and ePub downloads, according to the available data) and Abstracts Views on Vision4Press platform.
Data correspond to usage on the plateform after 2015. The current usage metrics is available 48-96 hours after online publication and is updated daily on week days.
Initial download of the metrics may take a while.