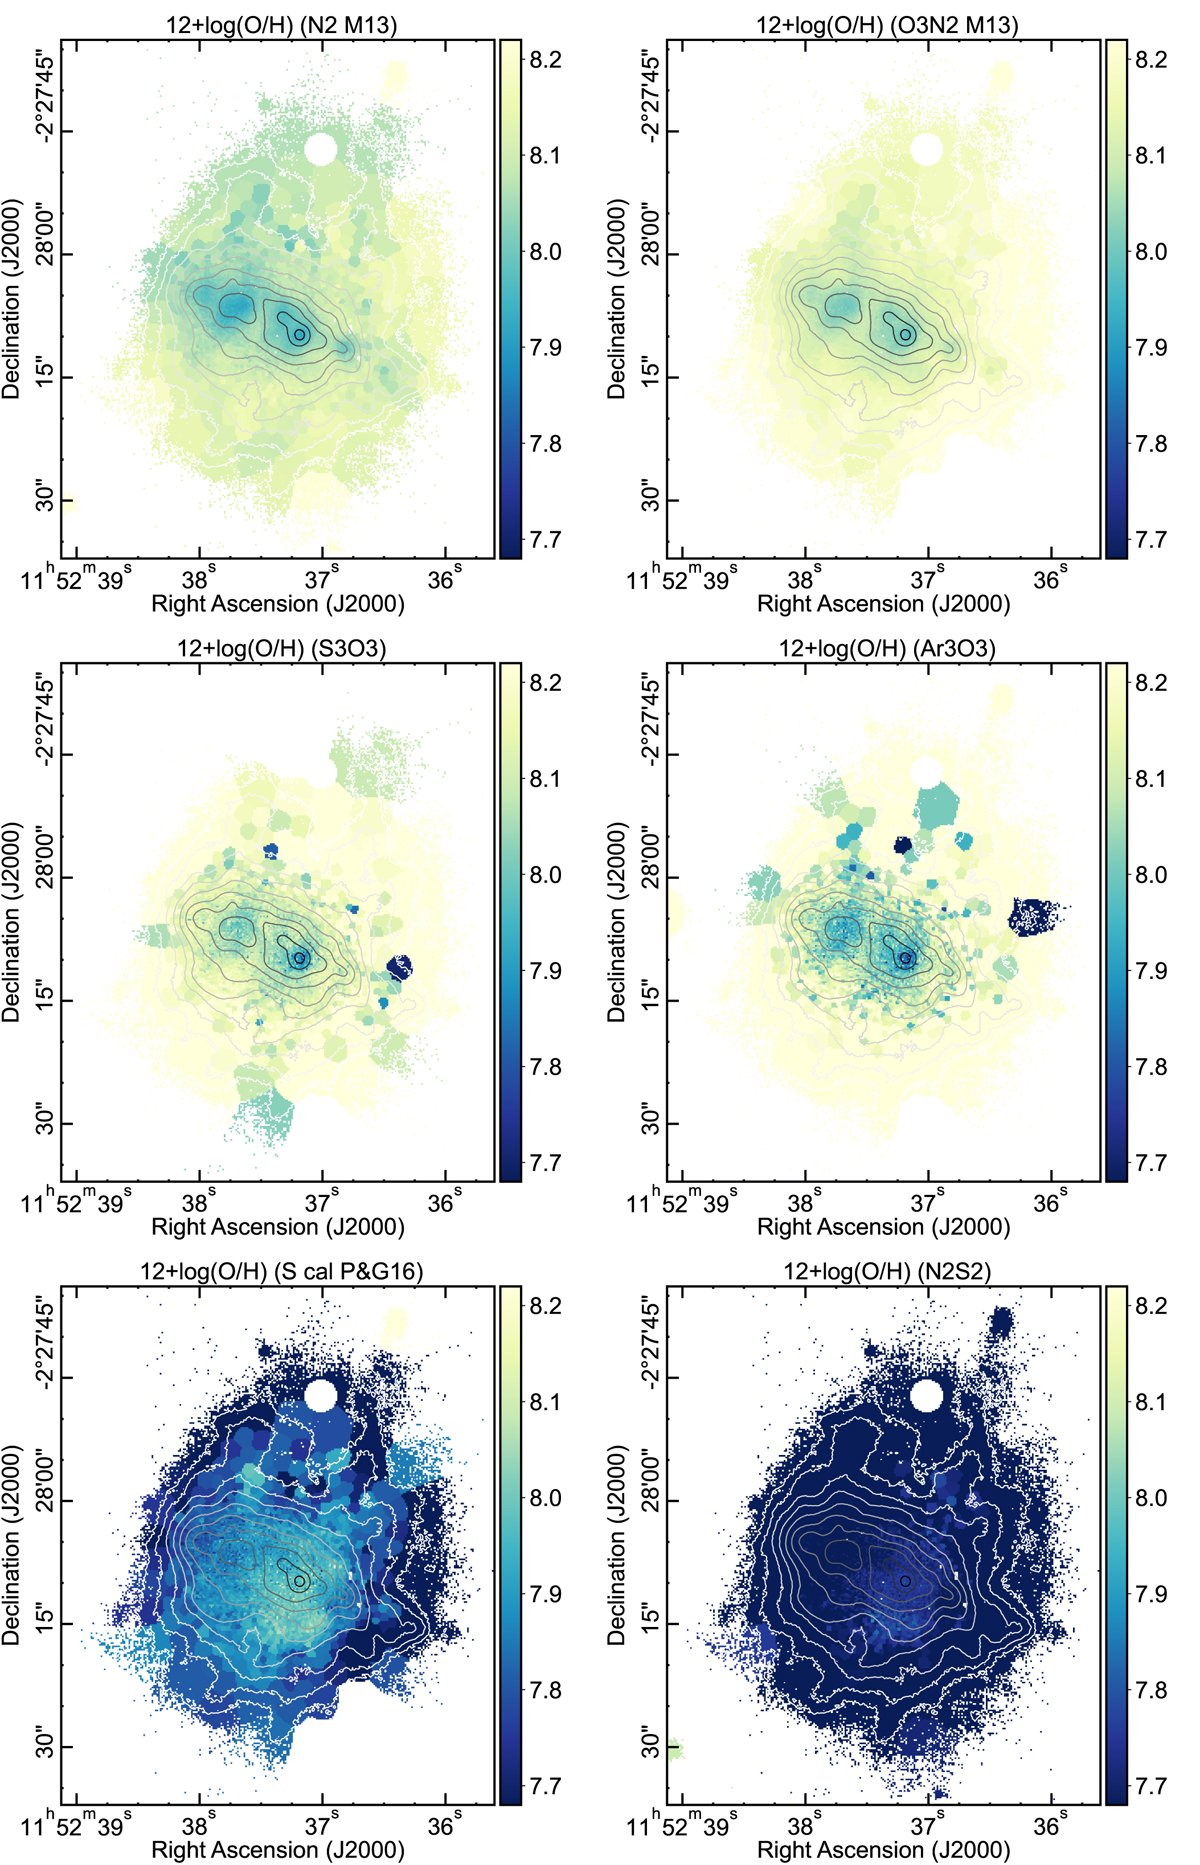
Fig. 22.
Download original image
Maps of total oxygen abundance derived by means of different strong line methods. Upper row: calibrations by Marino et al. (2013) for the N2 (left) and the O3N2 (right) methods. Middle row: calibrations by Stasińska (2006) for the S3O3 (left) and Ar3O3 (right) methods. Lower row: S calibration by Pilyugin & Grebel (2016) (left) and N2S2 calibration by Dopita et al. (2016) (right).
Current usage metrics show cumulative count of Article Views (full-text article views including HTML views, PDF and ePub downloads, according to the available data) and Abstracts Views on Vision4Press platform.
Data correspond to usage on the plateform after 2015. The current usage metrics is available 48-96 hours after online publication and is updated daily on week days.
Initial download of the metrics may take a while.