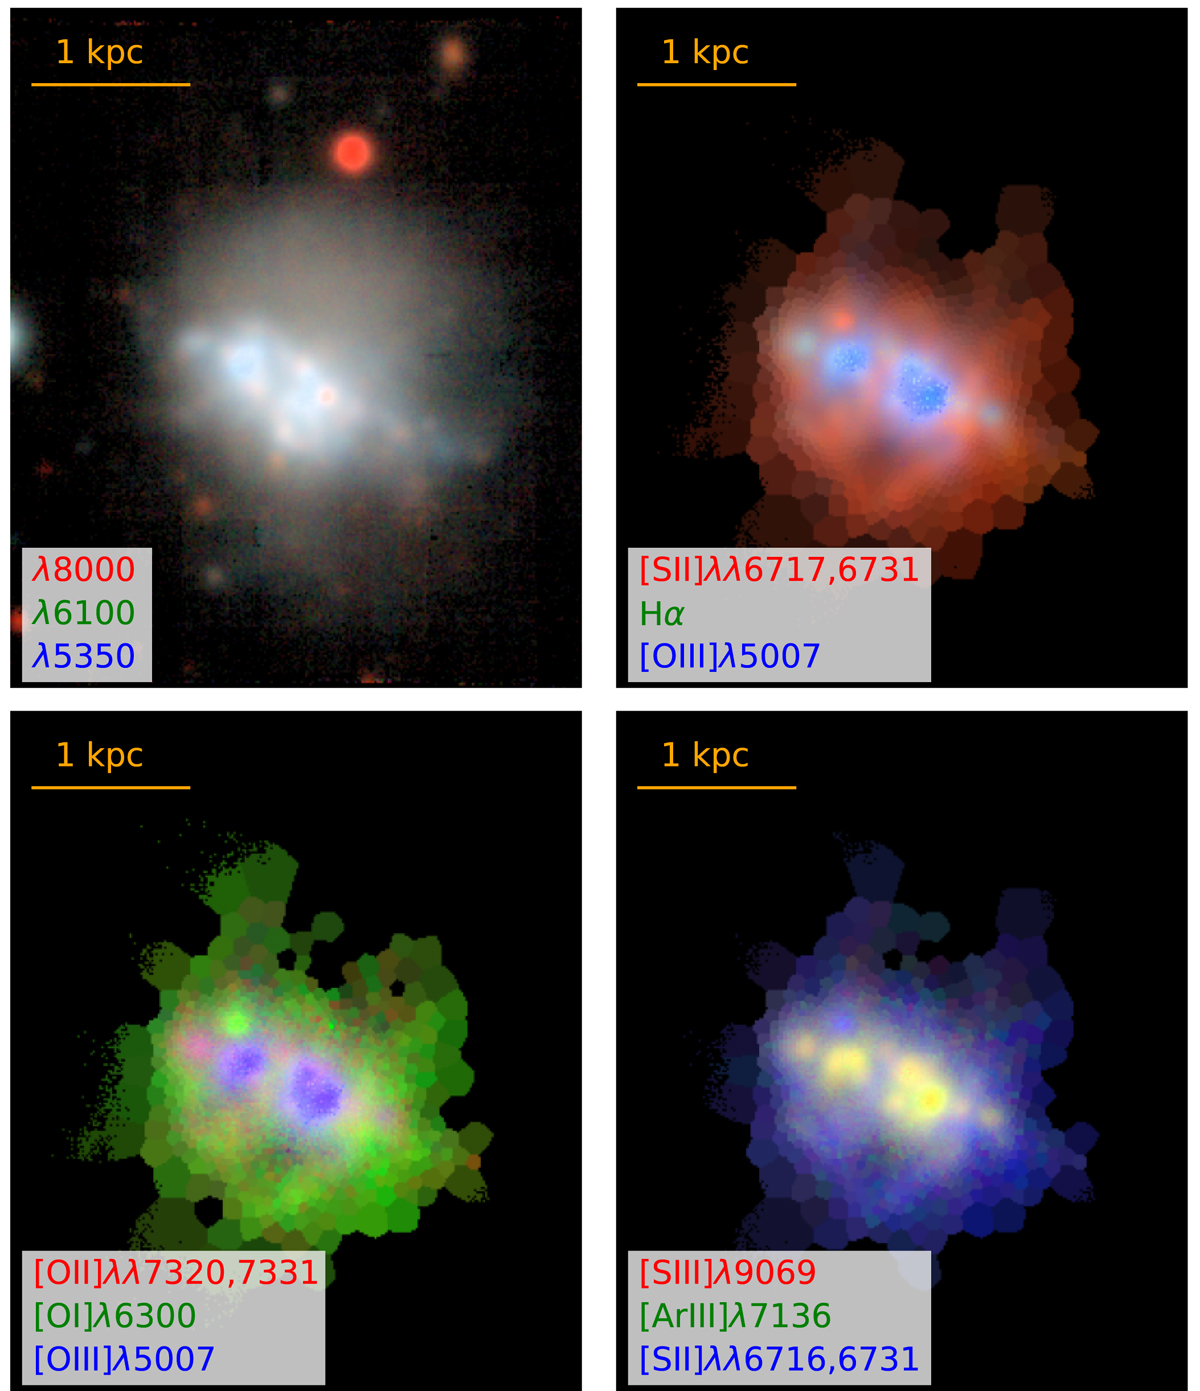
Fig. 2.
Download original image
Set of four RGB images. Individual images were allocated in the corresponding channel ordered by wavelength (i.e. reddest filter in the R channel, central filter in the G channel and bluest filter in the B channel). The first panel was made with three images extracted from the MUSE data in 100 Å-wide line-free spectral ranges. Central wavelengths are listed. The other three panels are RGB images made with different sets of emission line fluxes derived by means of Gaussian line fitting, and after having tessellated the MUSE field of view to increase the S/N of the data. The second panel contains, together with Hα, two of the strongest CELs, usually used for ionisation parameter mapping (Pellegrini et al. 2012). For the third panel, we used emission lines corresponding to three different ionisation degrees for oxygen: neutral, single ionised and two times ionised. The last one has maps for lines tracing the two ionisation states available for sulphur, and a line for two times ionised argon, the ion with the highest ionisation potential after the two times ionised oxygen with an available map. All four panels together summarise in a synthetic manner the structural information for the stars and the ionised gas. North is up and east towards the left.
Current usage metrics show cumulative count of Article Views (full-text article views including HTML views, PDF and ePub downloads, according to the available data) and Abstracts Views on Vision4Press platform.
Data correspond to usage on the plateform after 2015. The current usage metrics is available 48-96 hours after online publication and is updated daily on week days.
Initial download of the metrics may take a while.