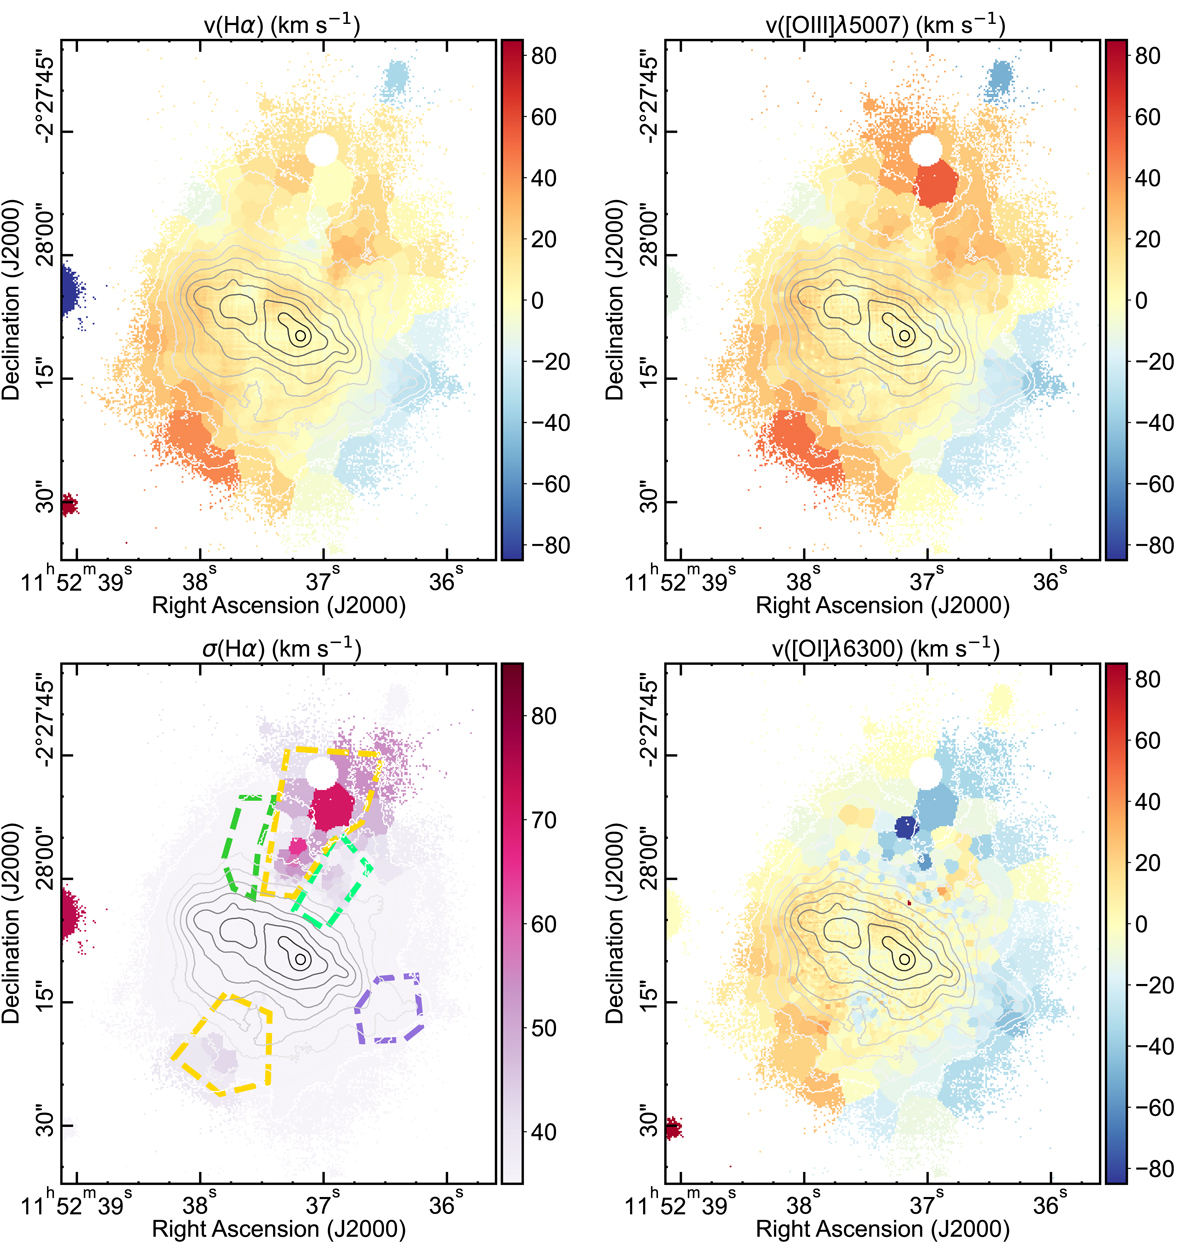
Fig. 19.

Download original image
Representative maps related with the kinematics of the galaxy. From top to bottom and from left to right, they are: Hα velocity field, a velocity field for a line tracing the high-ionisation zone ([O III]λ5007), Hα velocity dispersion map corrected for instrumental resolution, velocity field for a line tracing the low-ionisation zone ([O I]λ6300). Values for the velocities are presented as relative to the systemic velocity vsys = 1056 km s−1 as derived from the redshift reported in Table 1. For reference, the map in Hα flux made by line fitting on a spaxel-by-spaxel basis is overplotted with ten evenly spaced contours (in logarithmic scale) ranging from 1.26 × 10⁻¹⁸ erg cm−2 s−1 spaxel−1 to 1.26 × 10⁻¹⁵ erg cm−2 s−1 spaxel−1. North is up and east towards the left.
Current usage metrics show cumulative count of Article Views (full-text article views including HTML views, PDF and ePub downloads, according to the available data) and Abstracts Views on Vision4Press platform.
Data correspond to usage on the plateform after 2015. The current usage metrics is available 48-96 hours after online publication and is updated daily on week days.
Initial download of the metrics may take a while.


