Fig. 17.
Download original image
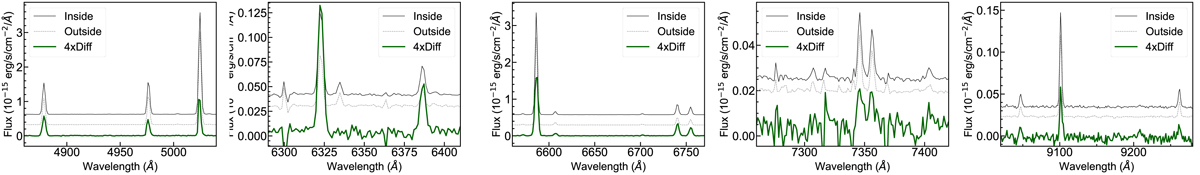
Selected windows for the spectrum of the SNR candidate. The recovered spectrum is displayed with a dark green thick continuum line. Besides, the total spectrum at the location point source under study (‘Inside’, black continuous thin line) and the spectrum used to subtract the background emission (‘Outside’, grey dashed thin line) are also displayed. To better see all the three spectra, the recovered spectrum was scaled by a factor ×4, and the ‘Inside’ and ‘Outside’ spectra are offset by ×0.1 and ×0.2 the peak value of ‘Inside’ in the displayed spectral window.
Current usage metrics show cumulative count of Article Views (full-text article views including HTML views, PDF and ePub downloads, according to the available data) and Abstracts Views on Vision4Press platform.
Data correspond to usage on the plateform after 2015. The current usage metrics is available 48-96 hours after online publication and is updated daily on week days.
Initial download of the metrics may take a while.