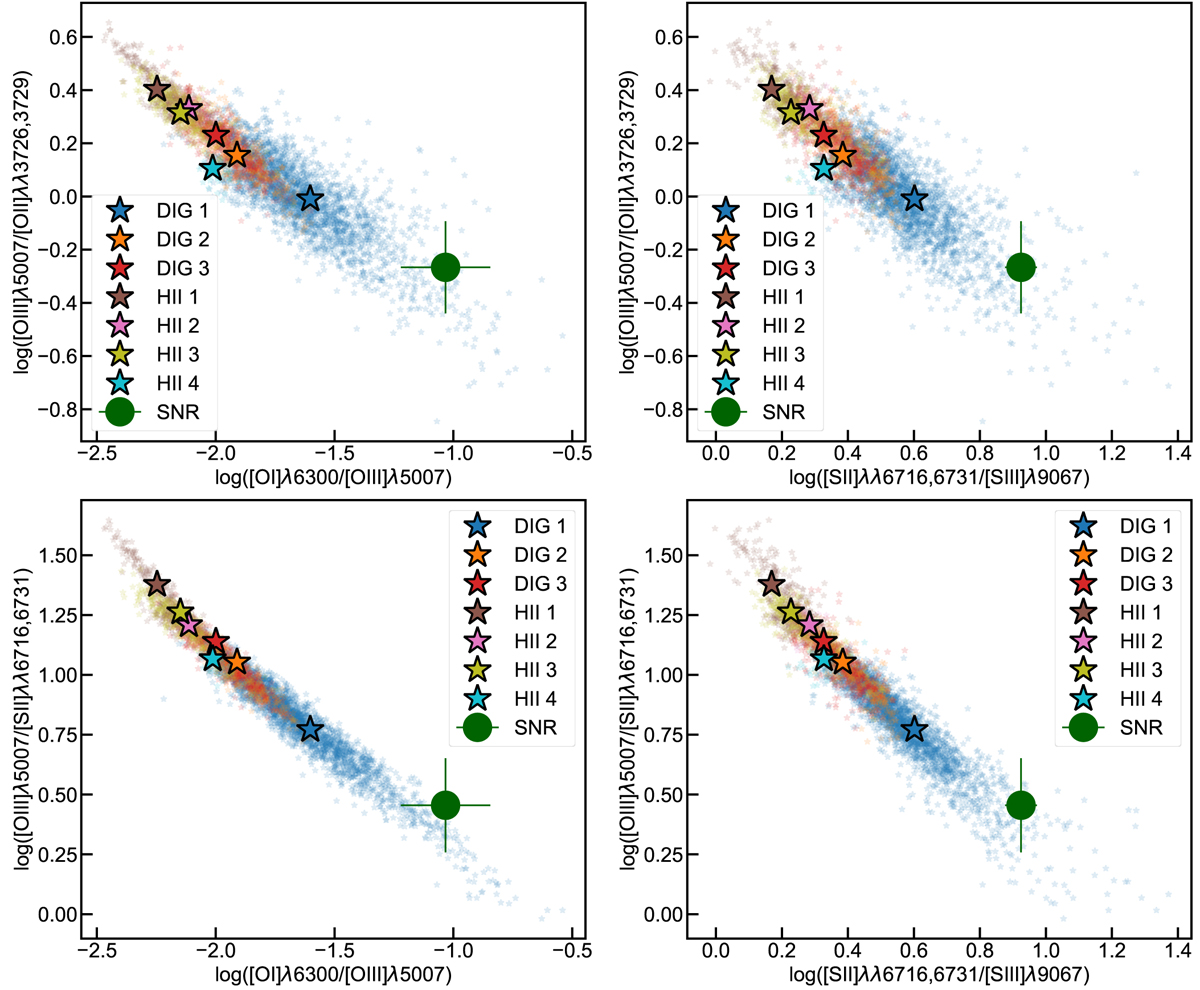
Fig. 15.
Download original image
Position of the individual tiles (small translucent stars) and the regions defined by astrodendro (large solid stars) in some additional diagnostic diagrams. Upper row: the so called O32−O13 and O32−S23 diagnostic diagrams presented by Ramambason et al. (2020). The [O II]λλ3726,3229 doublet is not covered by MUSE. Instead, we scaled the fluxes for [O II]λλ7320,7321 by ×48. The scaling factor was obtained by estimating the needed [O II]λλ3726,3229 fluxes to obtain the same ionic O+/H+ abundances as those reported in the apertures defined in Sect. 3.1. Lower row: similar to the upper row but the y-axis has been replaced by the [O III][O III]λ5007/[S II]λλ6761,6731 line ratio. Colour code is the same as in Fig. 13.
Current usage metrics show cumulative count of Article Views (full-text article views including HTML views, PDF and ePub downloads, according to the available data) and Abstracts Views on Vision4Press platform.
Data correspond to usage on the plateform after 2015. The current usage metrics is available 48-96 hours after online publication and is updated daily on week days.
Initial download of the metrics may take a while.