Open Access
Fig. 14.
Download original image
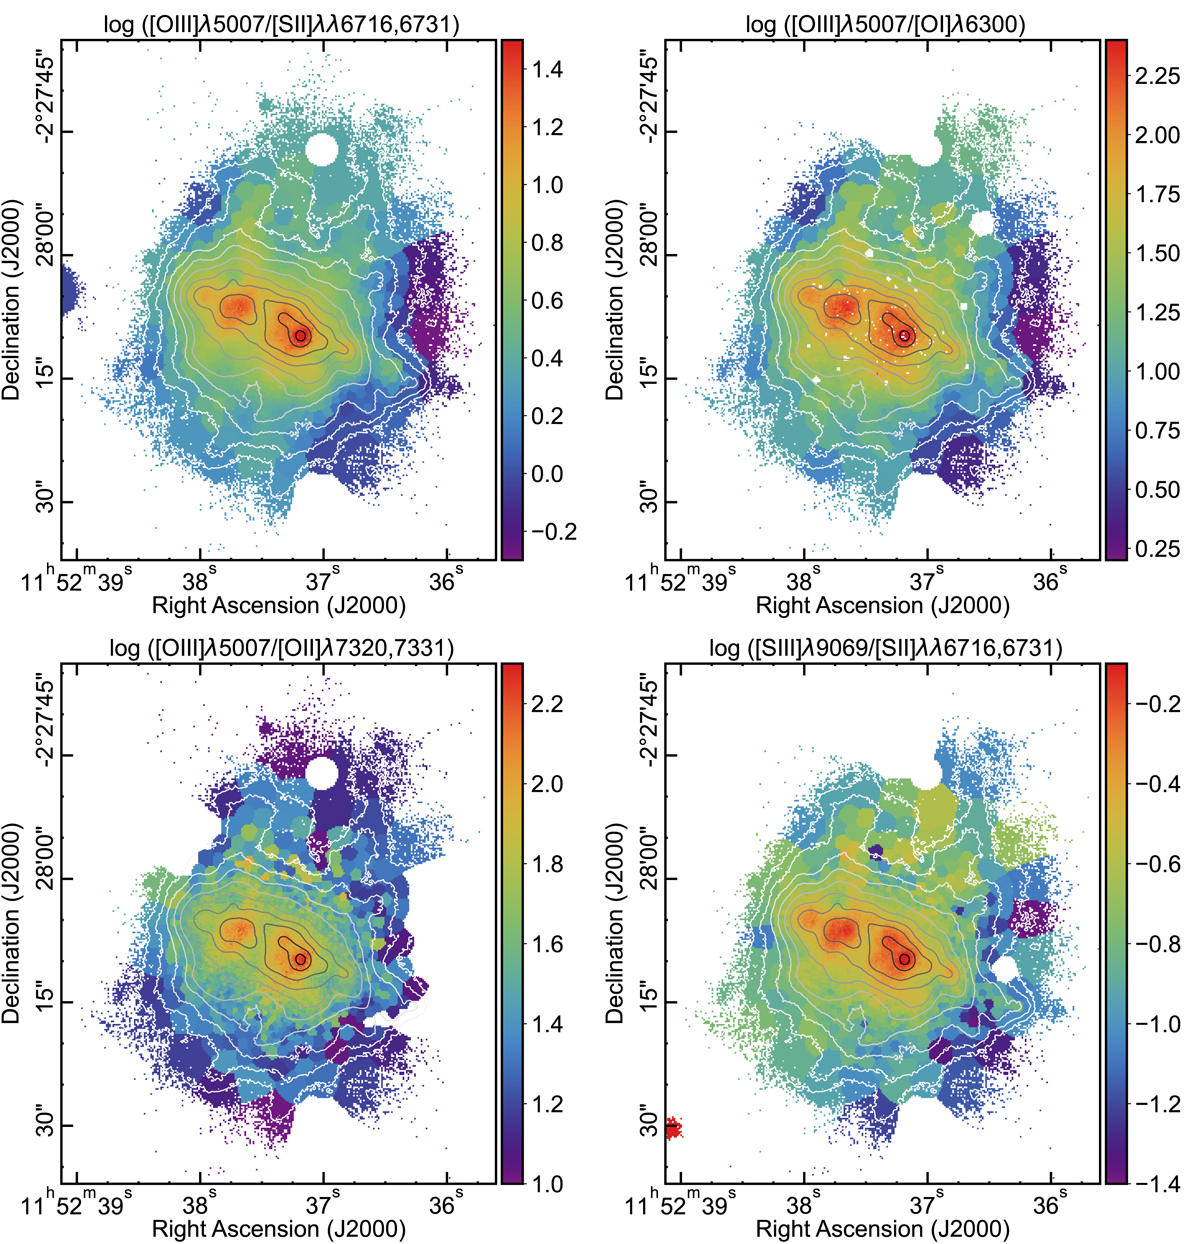
Maps for the line ratios tracing the ionisation parameter. [O III]/[S II] was introduced by Pellegrini et al. (2012), while the other ratios were used in the diagnostic diagrams presented by Ramambason et al. (2020). North is up and east towards the left.
Current usage metrics show cumulative count of Article Views (full-text article views including HTML views, PDF and ePub downloads, according to the available data) and Abstracts Views on Vision4Press platform.
Data correspond to usage on the plateform after 2015. The current usage metrics is available 48-96 hours after online publication and is updated daily on week days.
Initial download of the metrics may take a while.