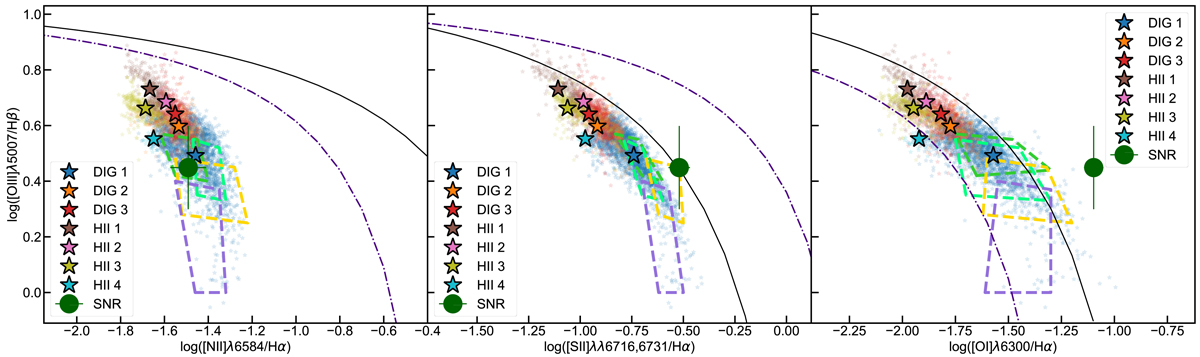
Fig. 13.
Download original image
Position of the individual tiles (small translucent stars) and the regions defined by astrodendro (large solid stars) in the so called BPT diagnostic diagrams (Baldwin et al. 1981). Black continuous lines show the theoretical borders proposed by Kewley et al. (2001) to delimit the area where the line ratios can be explained by star formation, while indigo dashed-dotted lines mark the maximal starburst prediction for an object with metallicities Z = 0.004, as derived by Xiao et al. (2018). The big green circle in each diagram represents the line ratios for the unresolved source at RA (J2000) = 11:52:37.8 and Dec (J2000) = −02:28:03.0, once fluxes have been decontaminated by the diffuse gas emission of the galaxy. The four irregular polygons with dashed lines aproximately delimit the locii of line ratios measured in the regions marked in Fig. 3.
Current usage metrics show cumulative count of Article Views (full-text article views including HTML views, PDF and ePub downloads, according to the available data) and Abstracts Views on Vision4Press platform.
Data correspond to usage on the plateform after 2015. The current usage metrics is available 48-96 hours after online publication and is updated daily on week days.
Initial download of the metrics may take a while.