Fig. 10.
Download original image
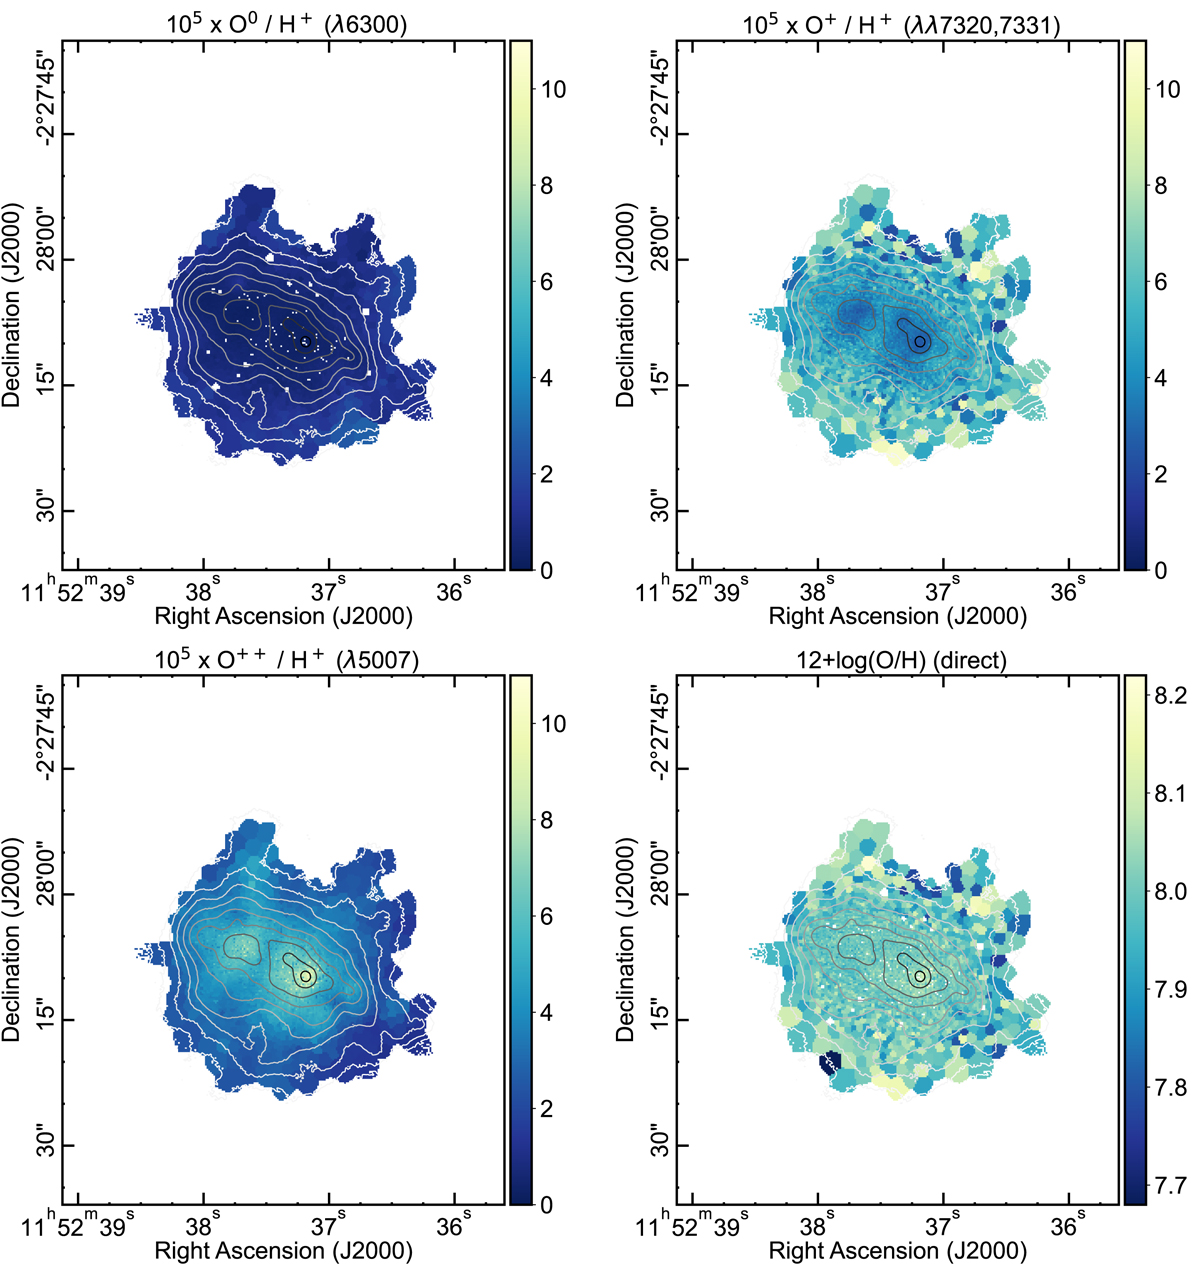
Maps for the O++ (top left), O+, (top right), and O0 (bottom left) ionic abundances, derived using the direct method as described in the text. All the three maps display the same range in abundance in order to emphasise the relative contribution of each ion in the different parts of the galaxy. The last map in this figure (bottom right) contains the total oxygen abundance map, 12 + log(O/H). North is up and east towards the left.
Current usage metrics show cumulative count of Article Views (full-text article views including HTML views, PDF and ePub downloads, according to the available data) and Abstracts Views on Vision4Press platform.
Data correspond to usage on the plateform after 2015. The current usage metrics is available 48-96 hours after online publication and is updated daily on week days.
Initial download of the metrics may take a while.