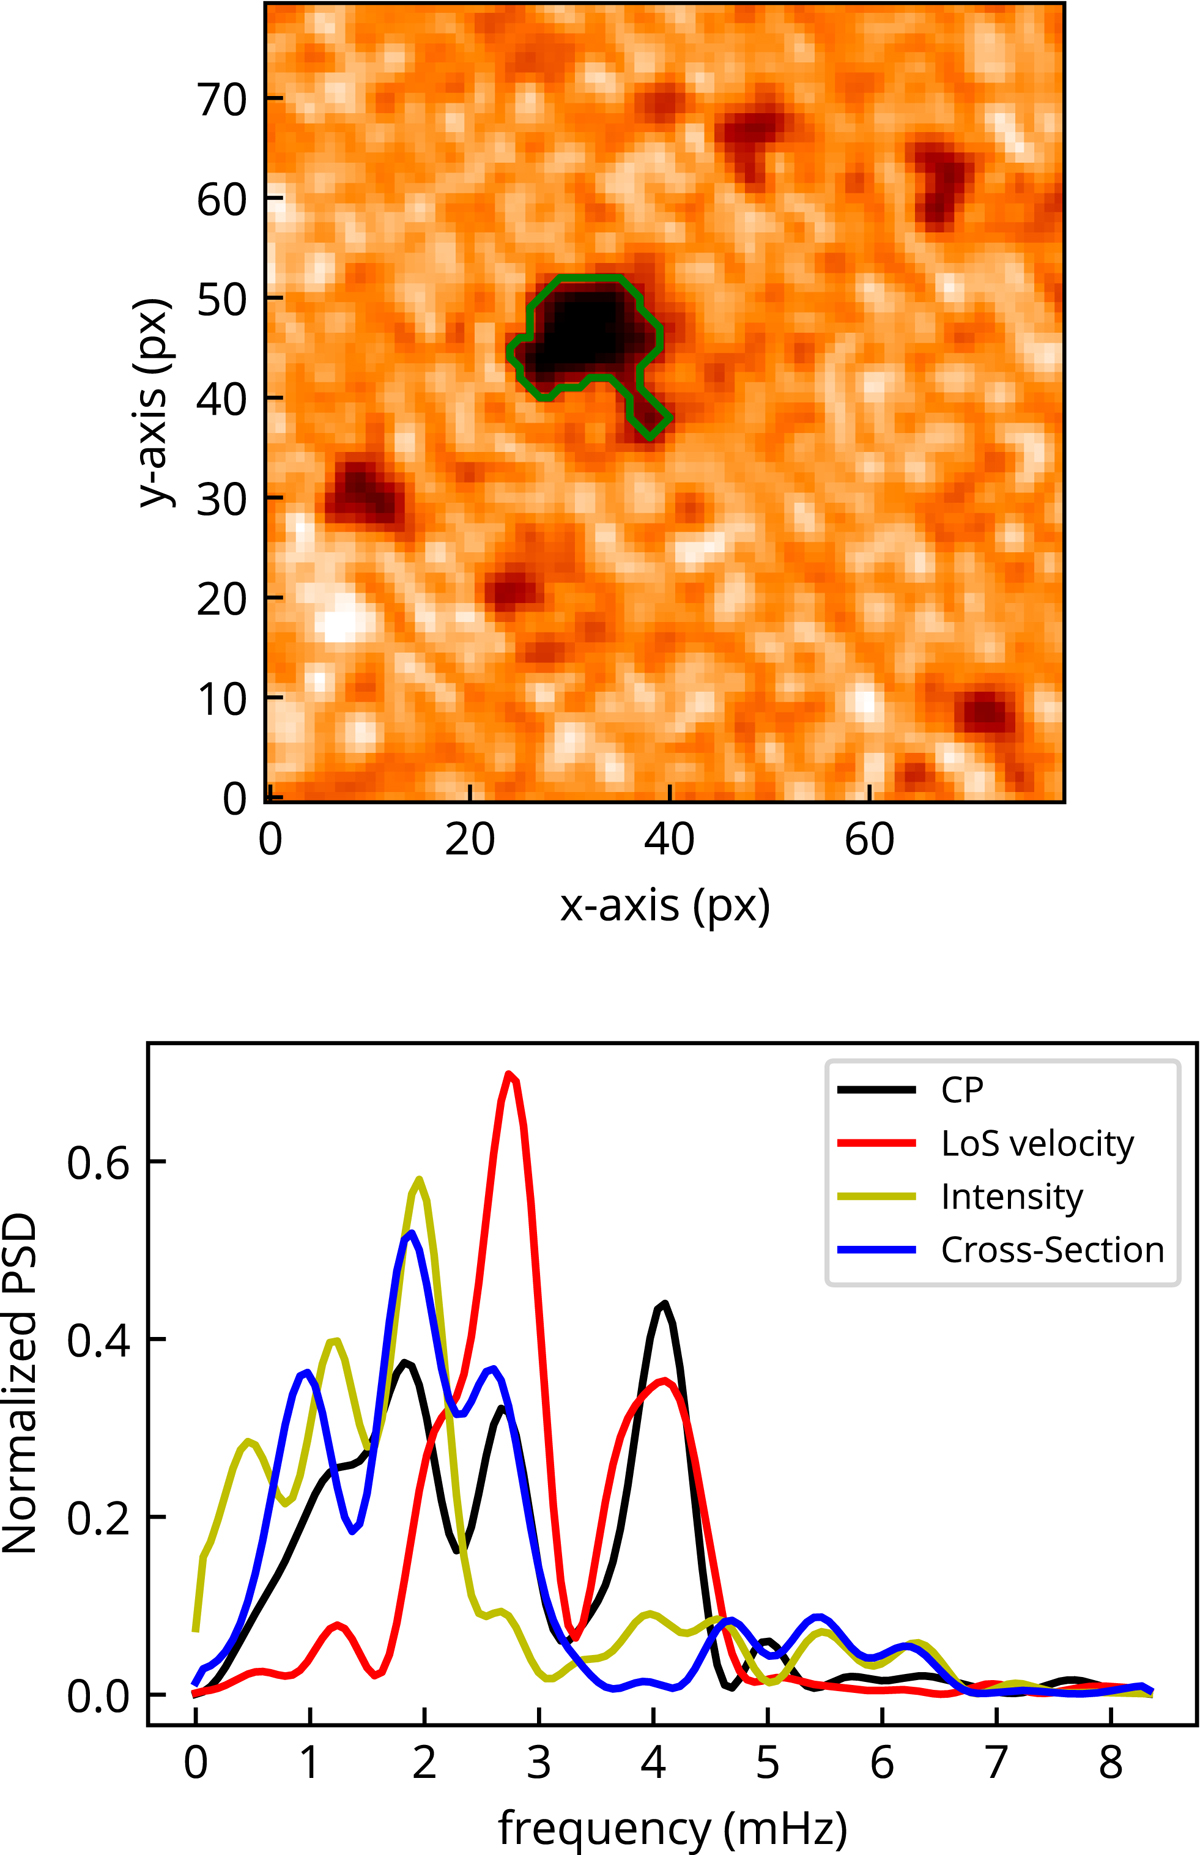
Fig. 5.
Download original image
Results of the Fourier analysis of RoI (4). Top panel: continuum intensity of RoI (4). The green contour shows the tracked region at this specific time step. Bottom panel: PSDs obtained by averaging the signal in the pore in RoI (4). Black line: CP. Red line: LoS velocity field. Yellow line: Continuum intensity. Blue line: Cross section. The PSDs have been normalized to their total power (i.e. frequency integrated).
Current usage metrics show cumulative count of Article Views (full-text article views including HTML views, PDF and ePub downloads, according to the available data) and Abstracts Views on Vision4Press platform.
Data correspond to usage on the plateform after 2015. The current usage metrics is available 48-96 hours after online publication and is updated daily on week days.
Initial download of the metrics may take a while.