Fig. 4.
Download original image
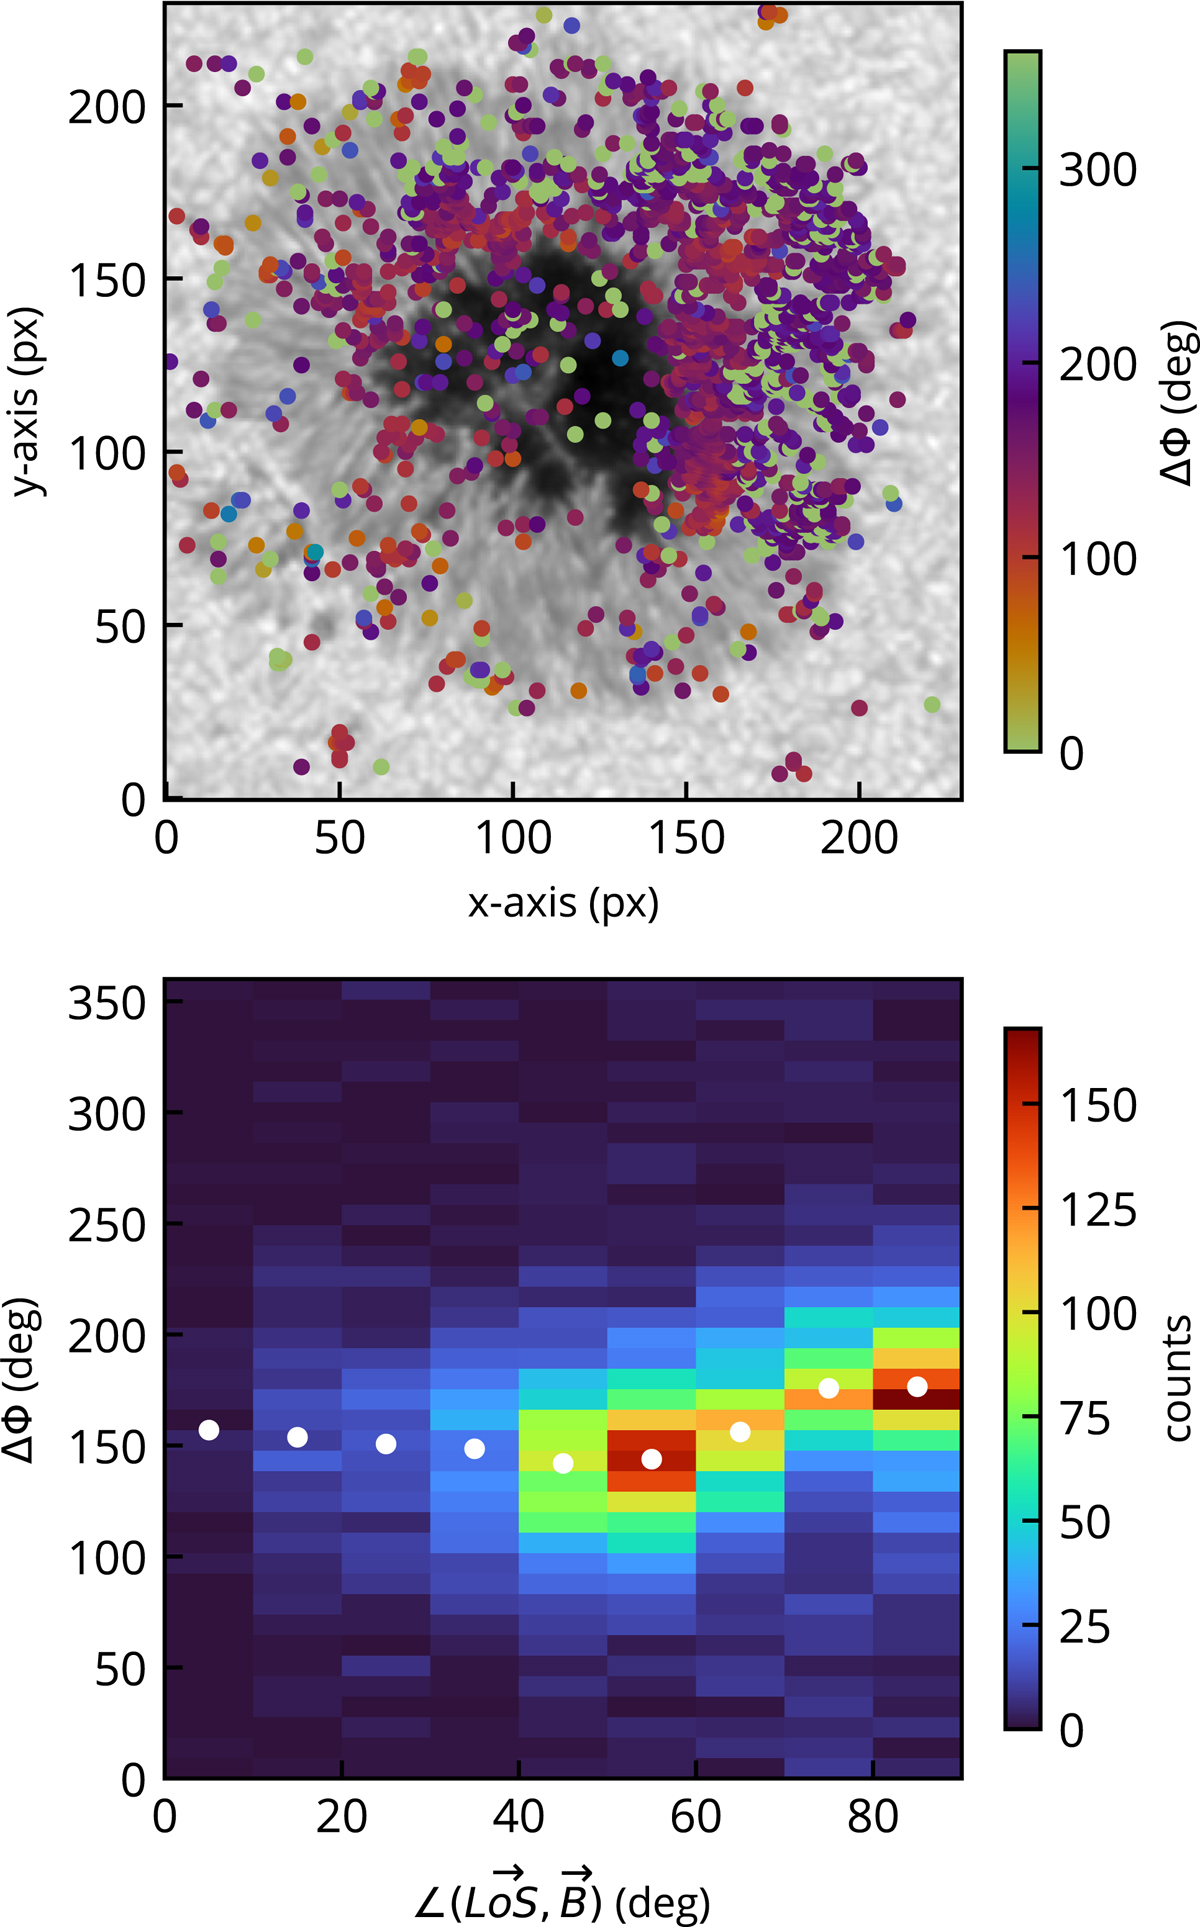
Results of the Fourier analysis for RoI (1). Top panel: continuum intensity of RoI (1). The phase-differences for the pixels show a high coherence between the LoS velocity and CP time series at 3.3 mHz that is over-plotted. The colour scale represents the values of the phase difference in each considered point. Bottom panel: 2D histogram as a function of the angle between the magnetic field vector and the LoS (x-axis) and the phase difference between the LoS velocity and CP time series at 3.3 mHz. The same points as in the upper panel have been used to build this diagram. The withe dots represent the central position obtained with a Gaussian fit of the phase-difference value at different angle bins.
Current usage metrics show cumulative count of Article Views (full-text article views including HTML views, PDF and ePub downloads, according to the available data) and Abstracts Views on Vision4Press platform.
Data correspond to usage on the plateform after 2015. The current usage metrics is available 48-96 hours after online publication and is updated daily on week days.
Initial download of the metrics may take a while.