Fig. 3.
Download original image
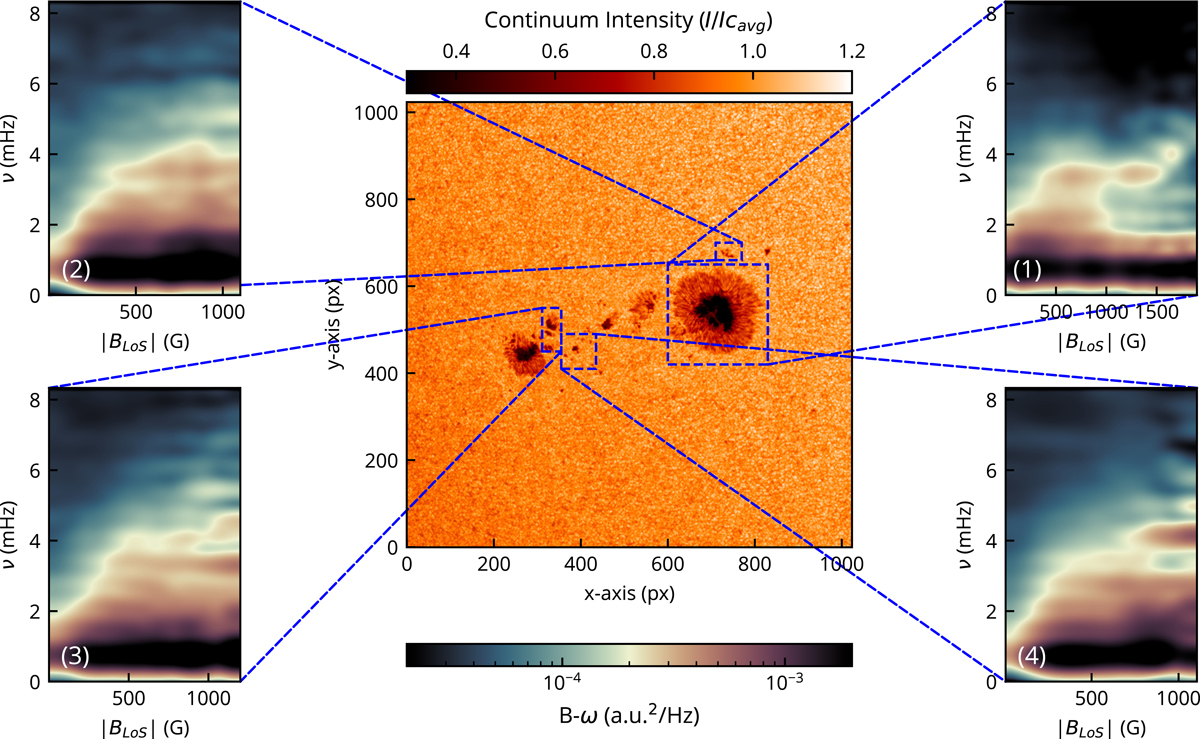
Results of the B-ω analysis on the CP time series. Central panel: same as for Fig. 2. Panels (1–4): B-ω diagrams of the PSD of the CP time series in the corresponding RoIs. The absolute value of the LoS magnetic field is plotted on the x-axes, and the frequency is plotted on the y-axes. The same colour scale has been used for all these panels and is shown below the central panel. We have chosen the saturation levels in order to emphasise the power increases in the magnetic regions. a.u. indicates arbitrary units.
Current usage metrics show cumulative count of Article Views (full-text article views including HTML views, PDF and ePub downloads, according to the available data) and Abstracts Views on Vision4Press platform.
Data correspond to usage on the plateform after 2015. The current usage metrics is available 48-96 hours after online publication and is updated daily on week days.
Initial download of the metrics may take a while.