Fig. 5.
Download original image
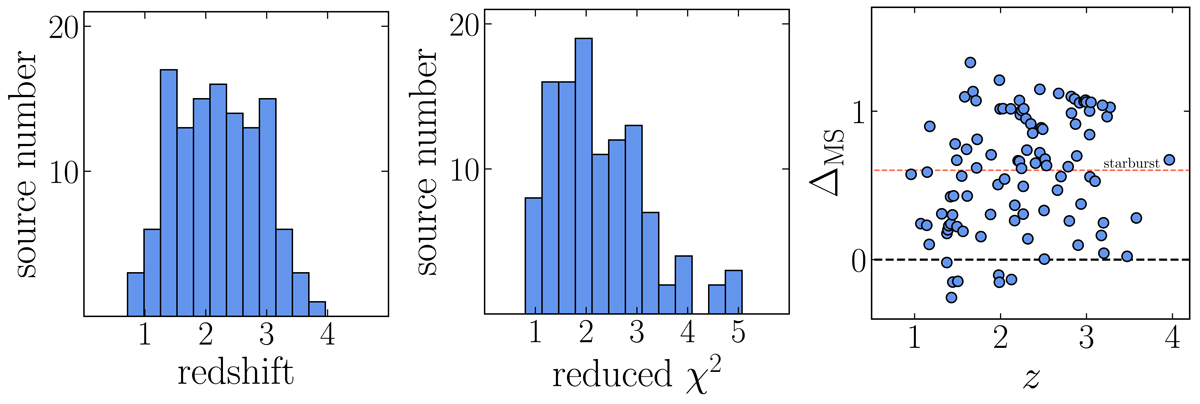
Redshift distribution of our sample of SFGs (left). Reduced χ2 of the best fits of the galaxies in our sample using CIGALE (middle). Variation of ΔMS (distance to the main sequence of SFGs of Speagle et al. 2014) of the sample with redshift (right). The red dotted line shows the area above which a galaxy is considered a starburst.
Current usage metrics show cumulative count of Article Views (full-text article views including HTML views, PDF and ePub downloads, according to the available data) and Abstracts Views on Vision4Press platform.
Data correspond to usage on the plateform after 2015. The current usage metrics is available 48-96 hours after online publication and is updated daily on week days.
Initial download of the metrics may take a while.