Fig. 4.
Download original image
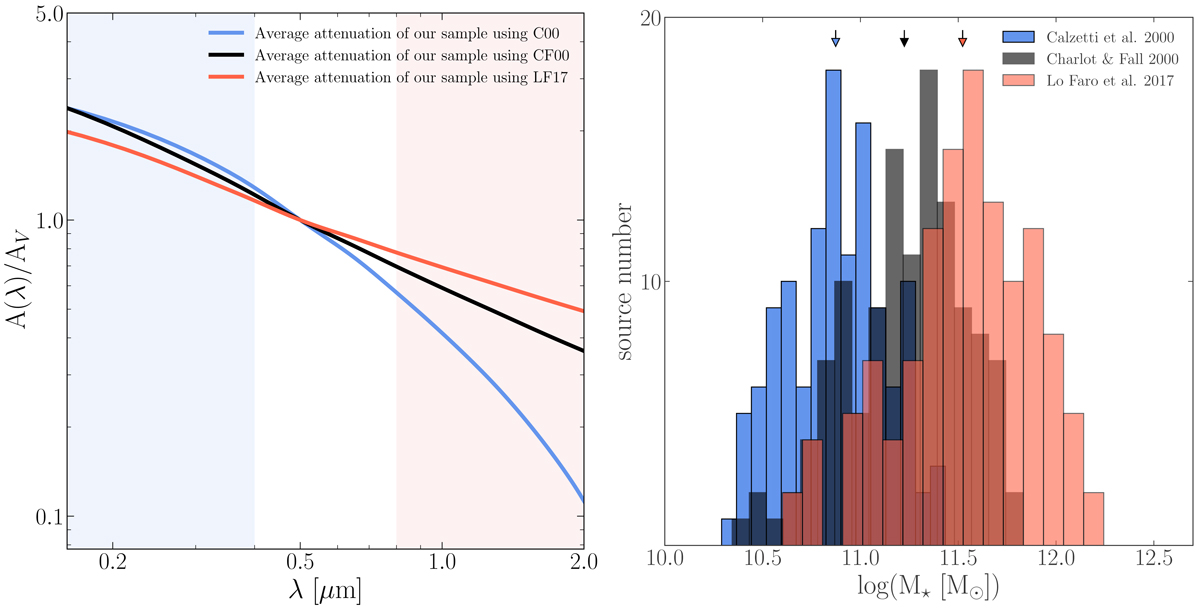
Average attenuation curves of our sample using three different attenuation laws/recipes (Calzetti et al. 2000; Charlot & Fall 2000; Lo Faro et al. 2017) shown on the left. In the case of CF00 and LF17 curves, we show the combined curve of the ISM and the BC. Stellar masses of our sample are shown on the right, which were derived using the three attenuation curves as in the left panel. The arrows show the mean of the specific distribution.
Current usage metrics show cumulative count of Article Views (full-text article views including HTML views, PDF and ePub downloads, according to the available data) and Abstracts Views on Vision4Press platform.
Data correspond to usage on the plateform after 2015. The current usage metrics is available 48-96 hours after online publication and is updated daily on week days.
Initial download of the metrics may take a while.