Fig. 3.
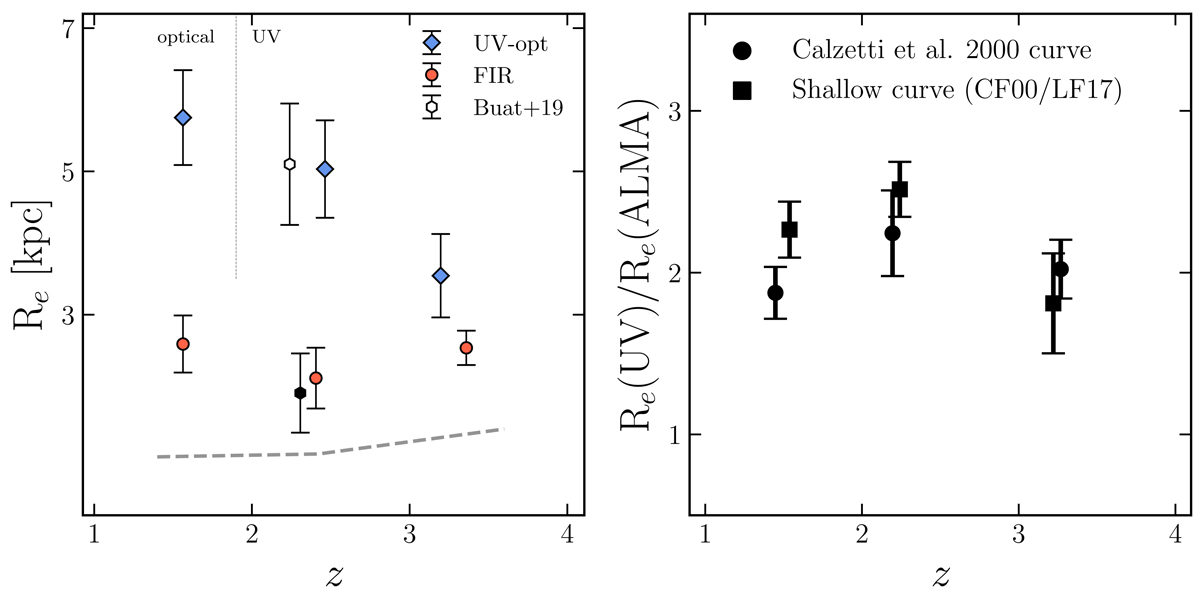
Download original image
Redshift evolution of the derived effective radii at two different wavelengths of our sample. The dashed line represents the redshift at which the Y band starts to probe the restframe UV (left). Hexagons show the binned sample of 17 galaxies from Buat et al. (2019) around z ∼ 2, taken from Elbaz et al. (2018) and Dunlop et al. (2017). Empty hexagons show the rest-frame UV radii while the filled ones show the ALMA detection. The dashed line shows the minimal size that can be measured with ALMA (Gómez-Guijarro et al. 2022). The evolution of Re(UV)/Re(ALMA) ratio with redshift in our sample of DSFGs is shown on the right.
Current usage metrics show cumulative count of Article Views (full-text article views including HTML views, PDF and ePub downloads, according to the available data) and Abstracts Views on Vision4Press platform.
Data correspond to usage on the plateform after 2015. The current usage metrics is available 48-96 hours after online publication and is updated daily on week days.
Initial download of the metrics may take a while.