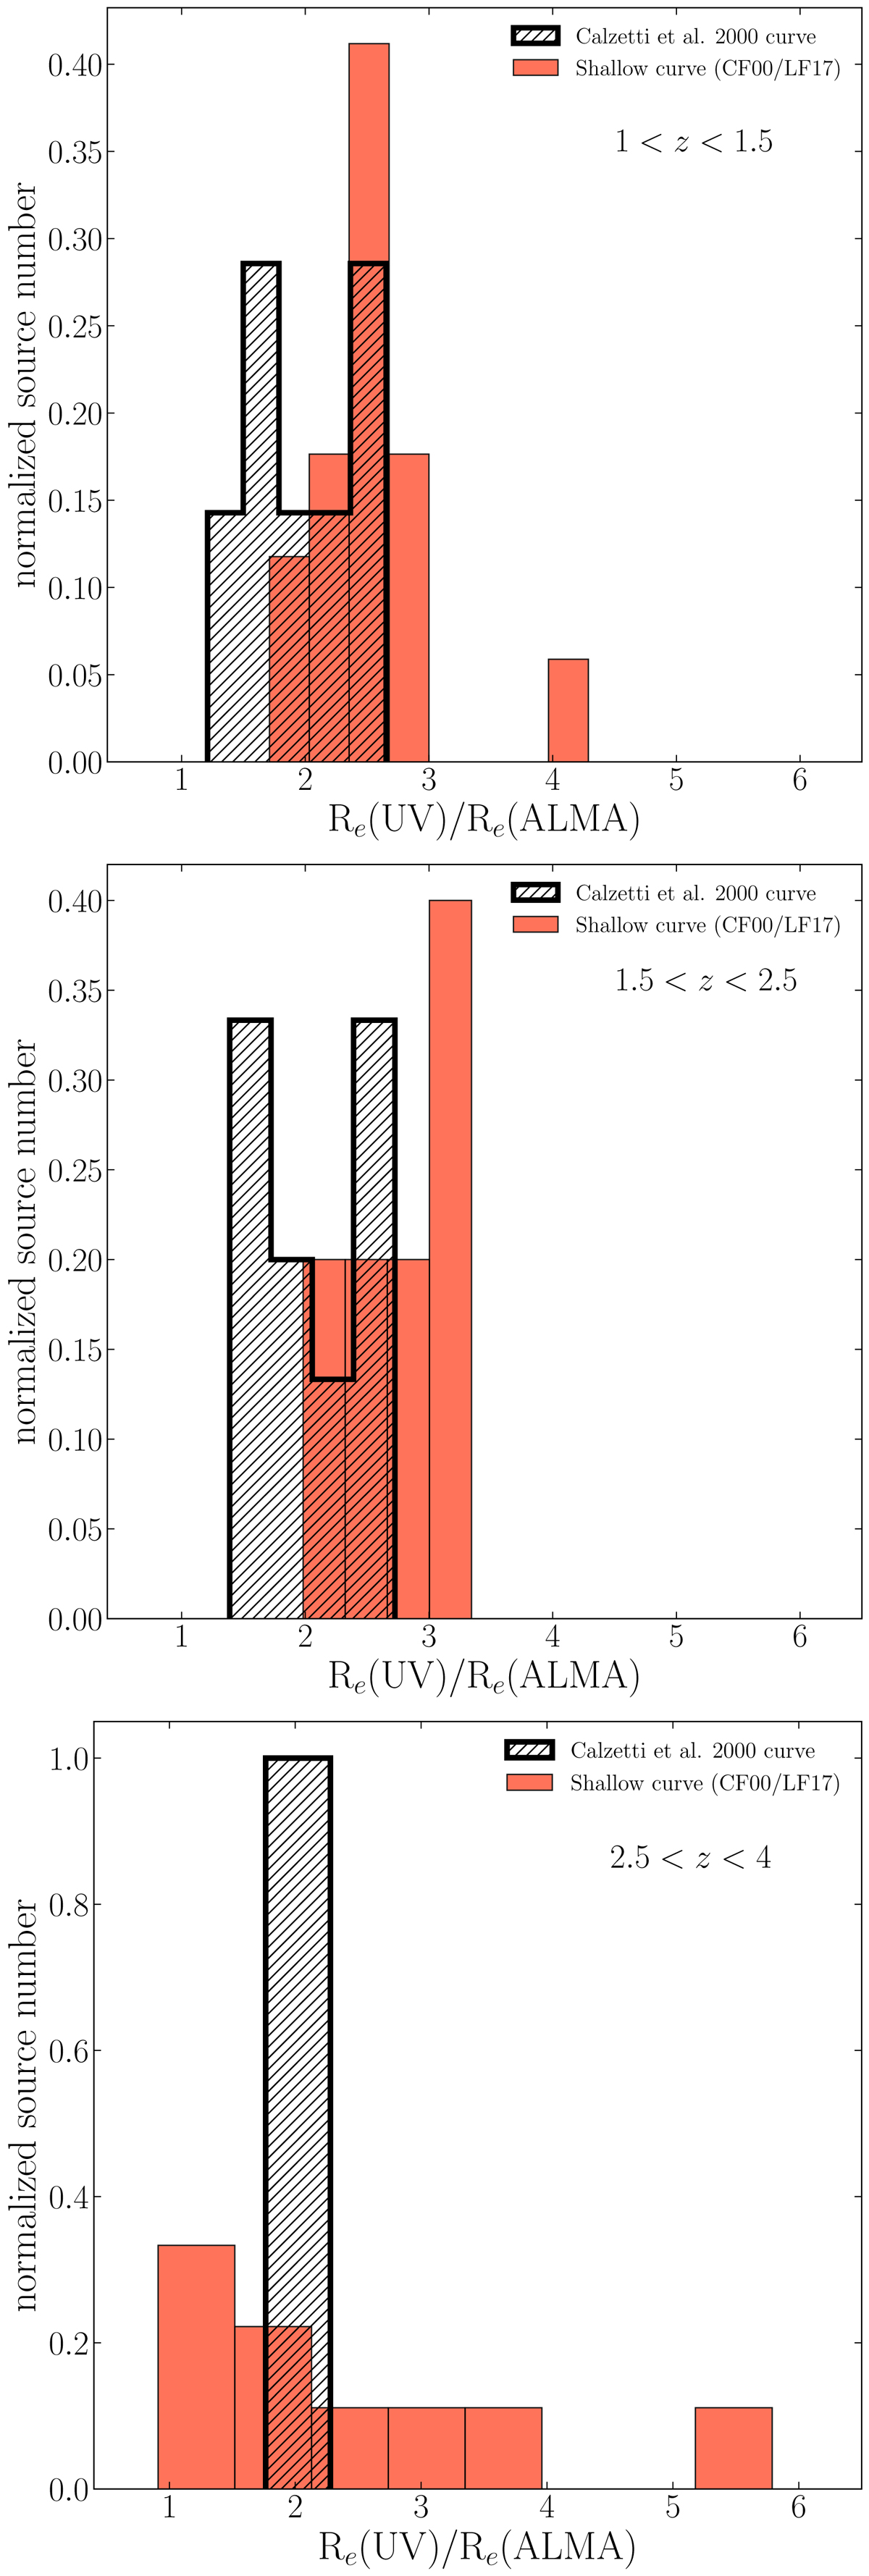
Fig. B.1.

Download original image
Histogram of the ratio of HSC’s Y band radius to the ALMA radius. The red-filled histograms at different redshift ranges represent galaxies for which a shallow attenuation curve of CF00 or LF17 was critical in order to reproduce the observed stellar light and resulted in better fits. The dashed histogram shows galaxies for which the C00 attenuation curve gave a satisfying fit.
Current usage metrics show cumulative count of Article Views (full-text article views including HTML views, PDF and ePub downloads, according to the available data) and Abstracts Views on Vision4Press platform.
Data correspond to usage on the plateform after 2015. The current usage metrics is available 48-96 hours after online publication and is updated daily on week days.
Initial download of the metrics may take a while.


