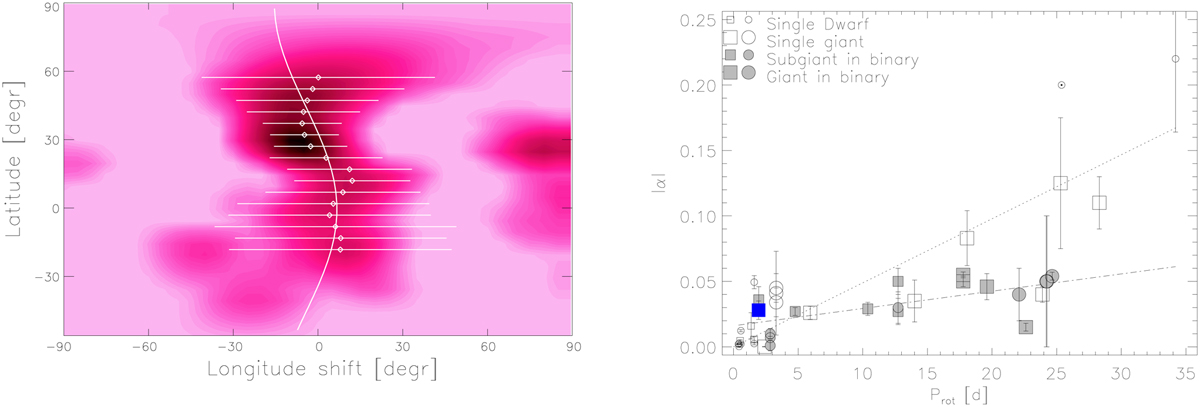
Fig. 8
Download original image
Measured surface differential rotation of EI Eri and its comparison to other stars. Left panel: average cross-correlation map for EI Eri. The correlation peaks (white circles) are fitted with a quadratic differential rotation law. The resulting fit (continuous line) indicates a solar-type differential rotation with a shear parameter α = 0.036 ± 0.007. Right panel: extended version of the surface shear coefficient versus rotational period plot from Kővári et al. (2017). Squares denote results from the cross-correlation technique, while circles show differential rotational coefficients from the sheared image method. White and gray symbols correspond to single and binary stars, respectively. Symbol size increases from dwarfs to subgiants to giants. EI Eri is represented by the blue square at Prot ≈ 2 days. The Sun is plotted with a dotted circle. The dotted and dash-dotted lines denote the linear fits to the points corresponding to singles and binaries, respectively, with slopes of |α| ∝ (0.0049 ± 0.00001)Prot and |α| ∝ (0.0014 ± 0.00003)Prot.
Current usage metrics show cumulative count of Article Views (full-text article views including HTML views, PDF and ePub downloads, according to the available data) and Abstracts Views on Vision4Press platform.
Data correspond to usage on the plateform after 2015. The current usage metrics is available 48-96 hours after online publication and is updated daily on week days.
Initial download of the metrics may take a while.