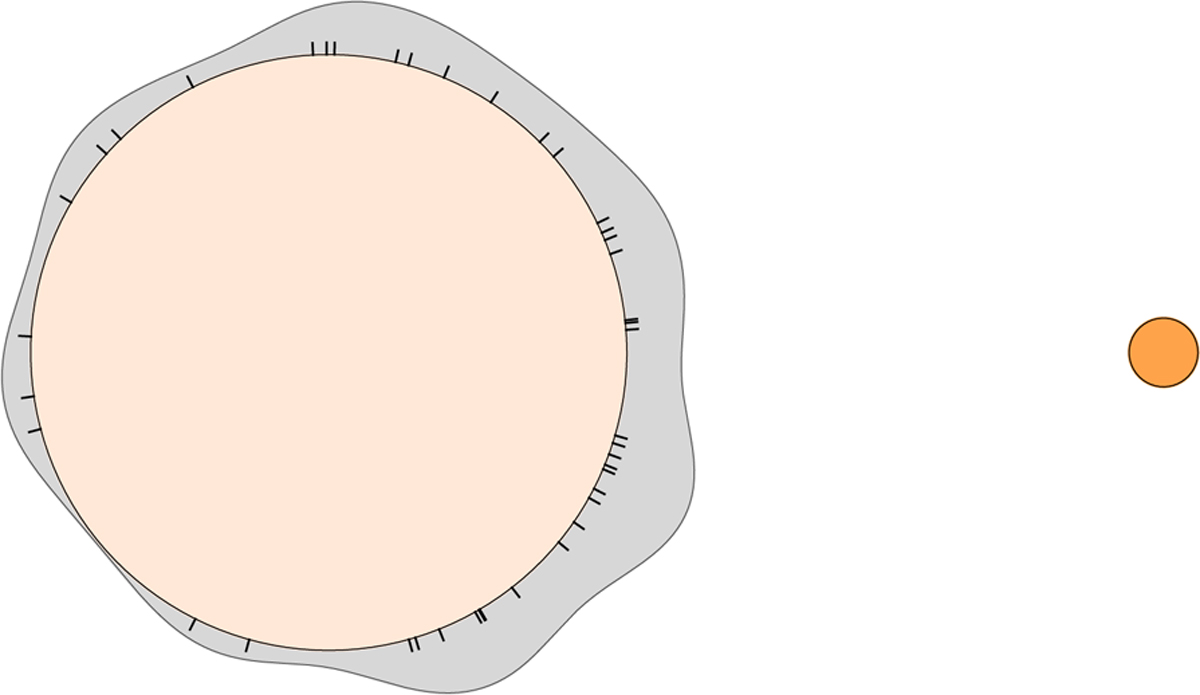
Fig. 6
Download original image
Phase distribution of the TESS flares on the primary component in the reference frame of the binary orbit. The relative radii and separation of the circles are for scale. The colors are realistic digital colors for the given spectral types from Harre & Heller (2021). The gray area shows a Gaussian kernel density estimation with the bandwidth of 2°. Black ticks denote the orbital phase values of the flare observations.
Current usage metrics show cumulative count of Article Views (full-text article views including HTML views, PDF and ePub downloads, according to the available data) and Abstracts Views on Vision4Press platform.
Data correspond to usage on the plateform after 2015. The current usage metrics is available 48-96 hours after online publication and is updated daily on week days.
Initial download of the metrics may take a while.