Open Access
Fig. 5
Download original image
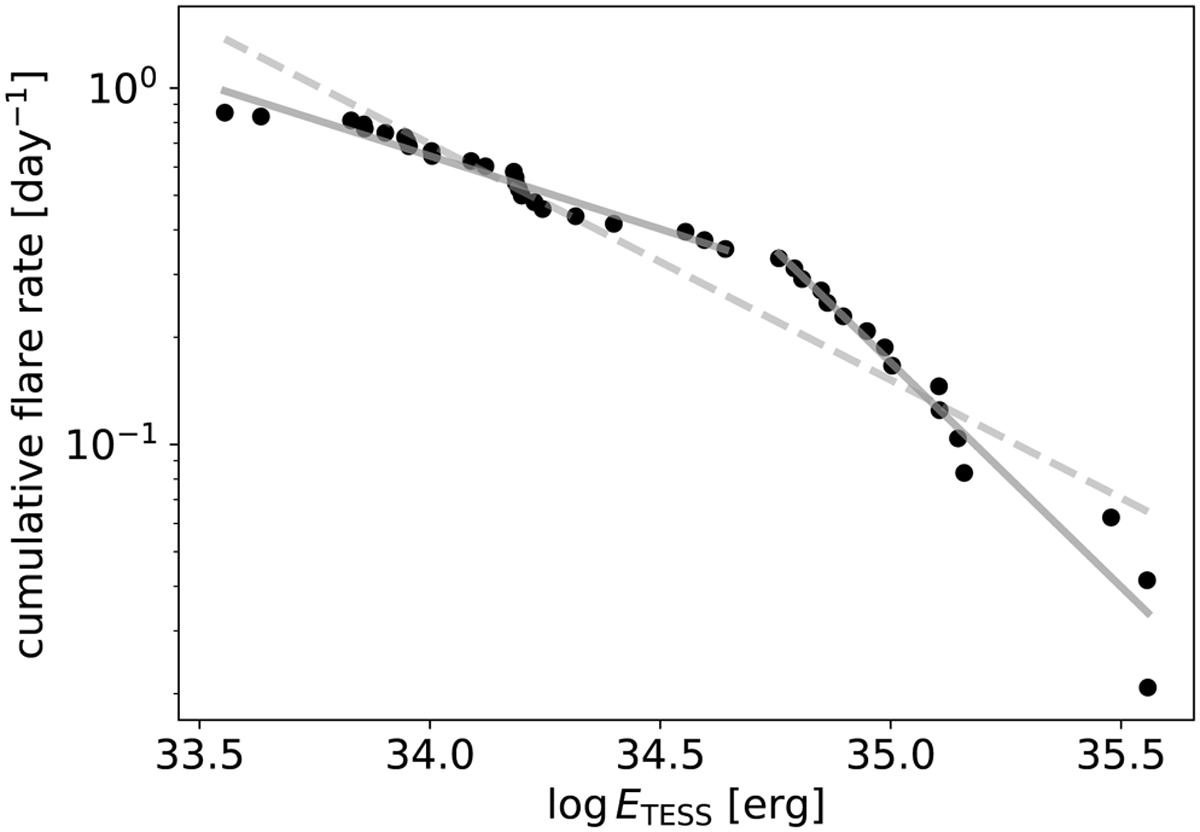
Flare-frequency distribution from the TESS data. The dashed line denotes a fit for all of the points with a power-law index of 1.66 ± 0.04, while the two solid lines show a two-component fit (1.41 ± 0.02 and 2.26 ± 0.08); see Sect. 3.2.
Current usage metrics show cumulative count of Article Views (full-text article views including HTML views, PDF and ePub downloads, according to the available data) and Abstracts Views on Vision4Press platform.
Data correspond to usage on the plateform after 2015. The current usage metrics is available 48-96 hours after online publication and is updated daily on week days.
Initial download of the metrics may take a while.