Fig. A.3
Download original image
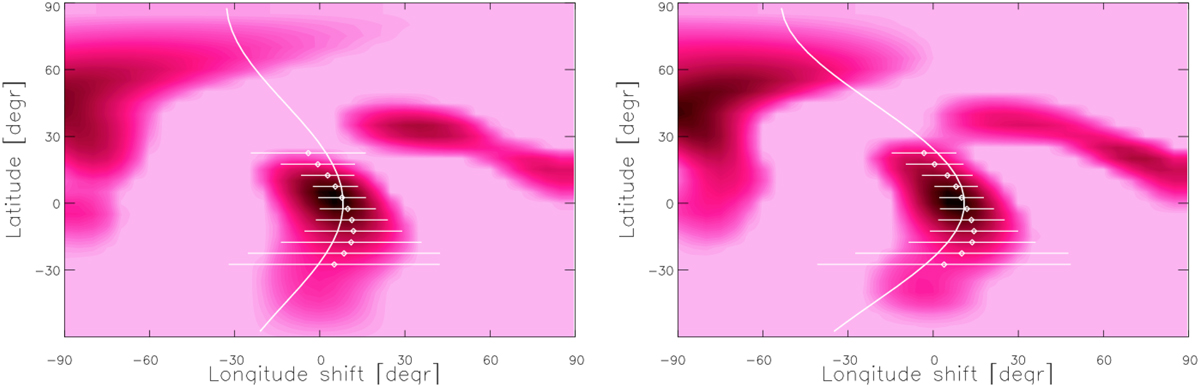
Example cross-correlation test maps of V1358 Ori with their fitted surface differential rotation functions obtained for different spectral resolutions of R=20 000 (left) and R=70 000 (right). The derived surface shear coefficients are α = 0.010 ± 0.0025 and α = 0.015 ± 0.003, respectively. For the original cross-correlation map see Kriskovics et al. (2019).
Current usage metrics show cumulative count of Article Views (full-text article views including HTML views, PDF and ePub downloads, according to the available data) and Abstracts Views on Vision4Press platform.
Data correspond to usage on the plateform after 2015. The current usage metrics is available 48-96 hours after online publication and is updated daily on week days.
Initial download of the metrics may take a while.