Fig. 1
Download original image
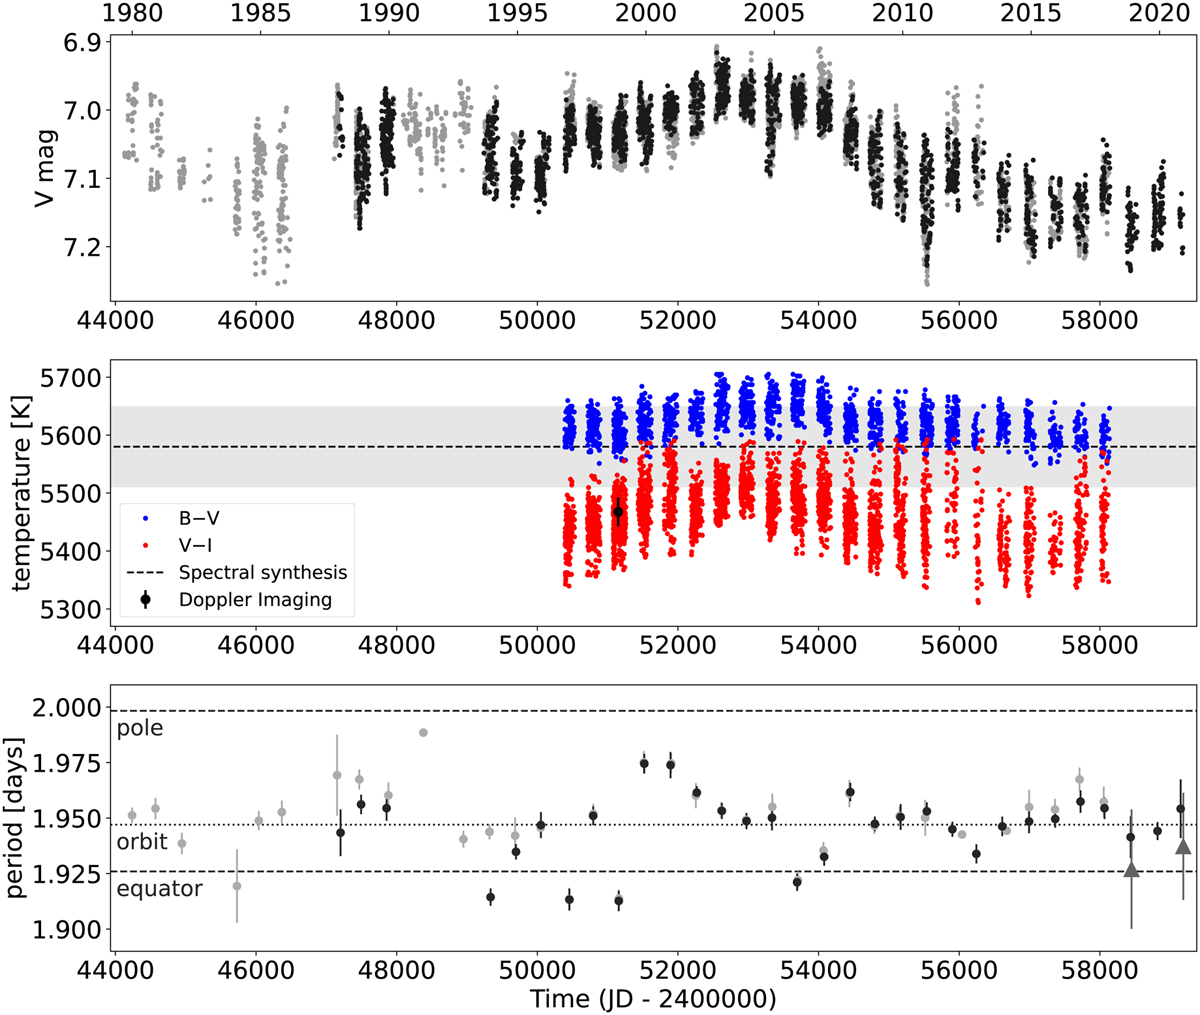
Available ground-based photometry, calculated temperature curves and yearly rotational periods for EI Eri. Top panel: ground-based Johnson V light curve of EI Eri from the Potsdam Wolfgang APT at Fairborn Observatory and from the literature (grey dots) and from Jetsu et al. (2017) and present paper (black dots). Middle panel: temperatures from B − V (blue) and V – I (red). The dashed line and the grey area denote the effective temperature from spectral synthesis with 1σ error (Teff = 5580 ± 70 K, see Sect. 4.1). Black dot shows the averaged surface temperature value from the four Doppler maps (〈T〉 = 5467 ± 25 K, see Sect. 4.3). Bottom panel: yearly rotational periods from the V light curves with grey and black points, as on the upper panel and the two available TESS sectors (grey triangles). The dashed lines show the maximal (pole) and minimal (equator) rotational periods calculated using the differential rotation from the Doppler maps (see Sect. 4.4), while the dotted line denotes the orbital period.
Current usage metrics show cumulative count of Article Views (full-text article views including HTML views, PDF and ePub downloads, according to the available data) and Abstracts Views on Vision4Press platform.
Data correspond to usage on the plateform after 2015. The current usage metrics is available 48-96 hours after online publication and is updated daily on week days.
Initial download of the metrics may take a while.