Fig. A.5
Download original image
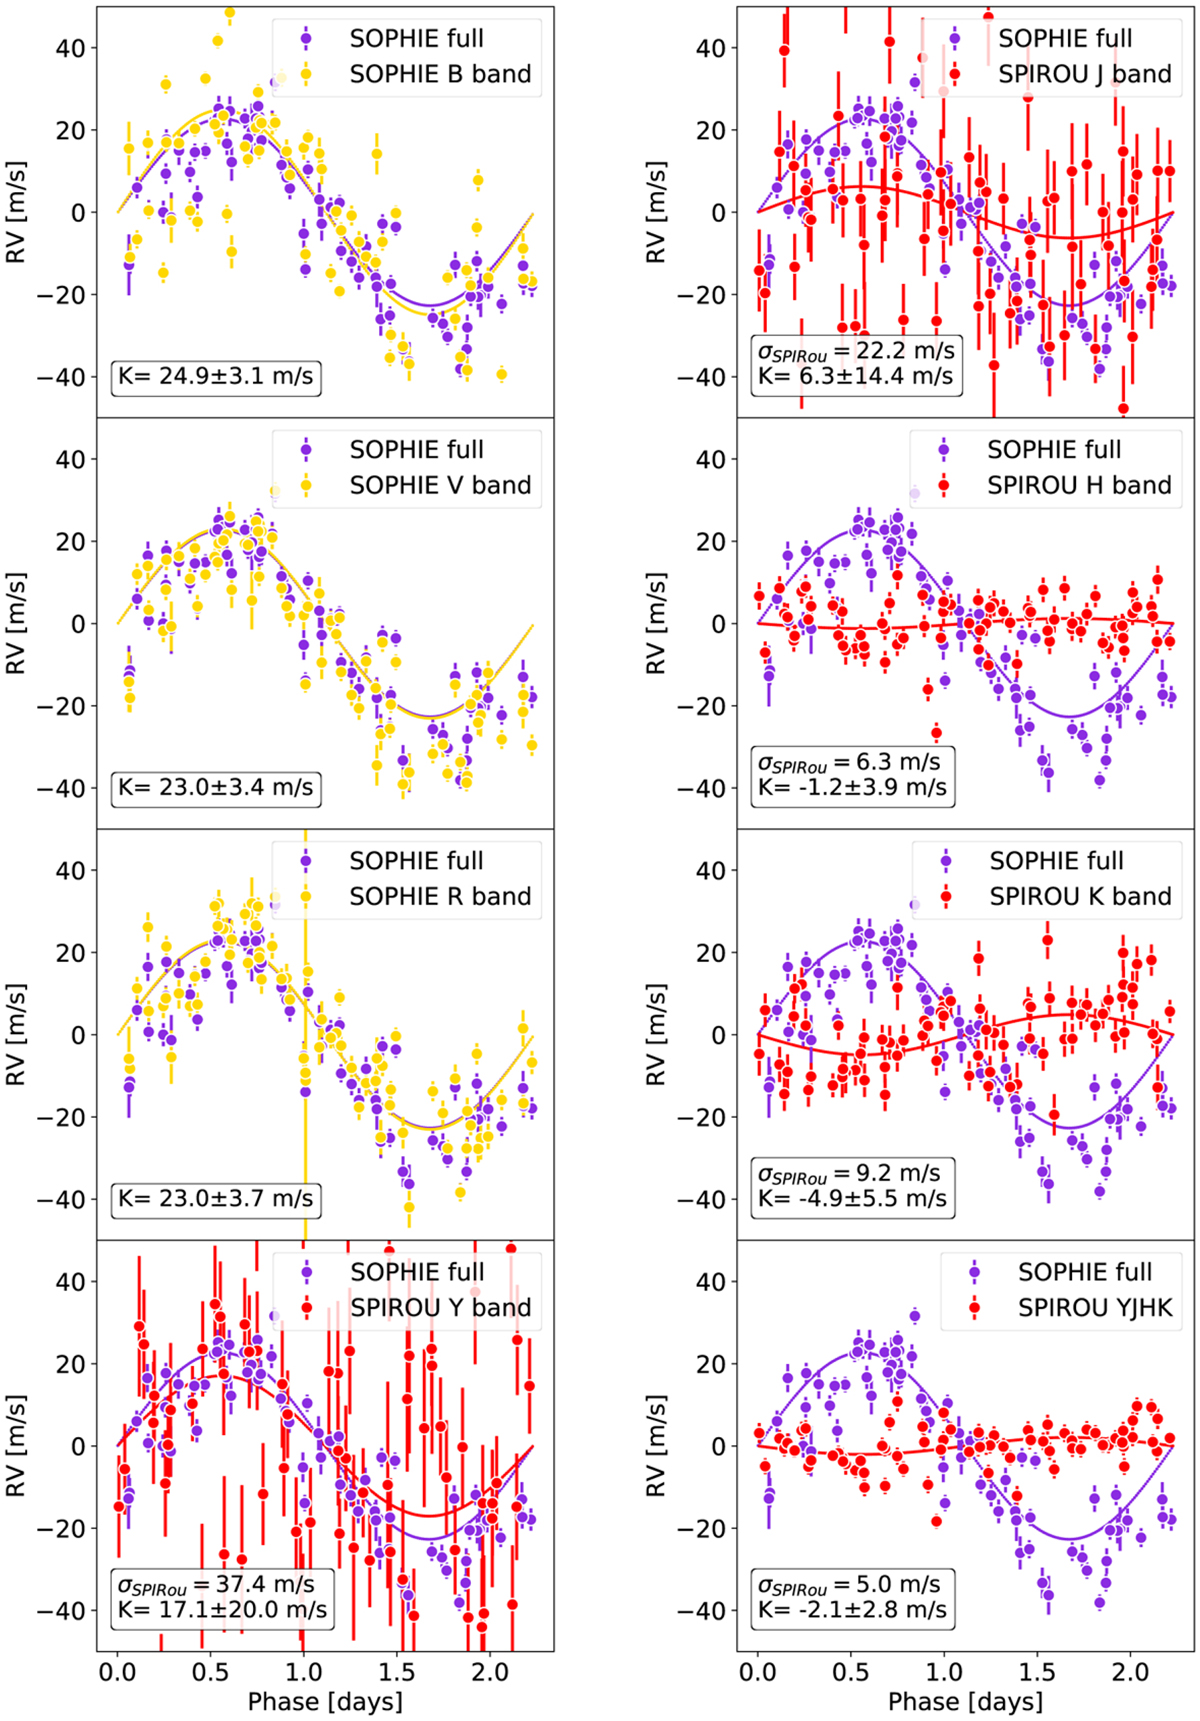
Phase-folded RVs in the B, V, and R bands for SOPHIE (yellow points) and in the Y, J, H, and K bands for SPIRou (red points). The best sinusoidal fit per band is given in a continuous line following the same color convention. For comparison, in each panel, we include (blue color) the phase-folded RVs and sinusoidal fit obtained in the full SOPHIE range. For the sinusoidal fit and RV phase-folding, the phase (i.e., T0) and period (2.23 days) are the same for all the time series. It is important to note that although a sinusoidal fit is possible in the SPIRou data, the periodograms show that there is no signal at the 2.23 day period (see Figure A.6). The SPIRou data are compatible with a straight line with K = 0 m s−1. The sinusoidal fit to the SPIRou data enabled us to set an upper limit on the RV dispersion that is smaller than the rms value.
Current usage metrics show cumulative count of Article Views (full-text article views including HTML views, PDF and ePub downloads, according to the available data) and Abstracts Views on Vision4Press platform.
Data correspond to usage on the plateform after 2015. The current usage metrics is available 48-96 hours after online publication and is updated daily on week days.
Initial download of the metrics may take a while.