Fig. A.1
Download original image
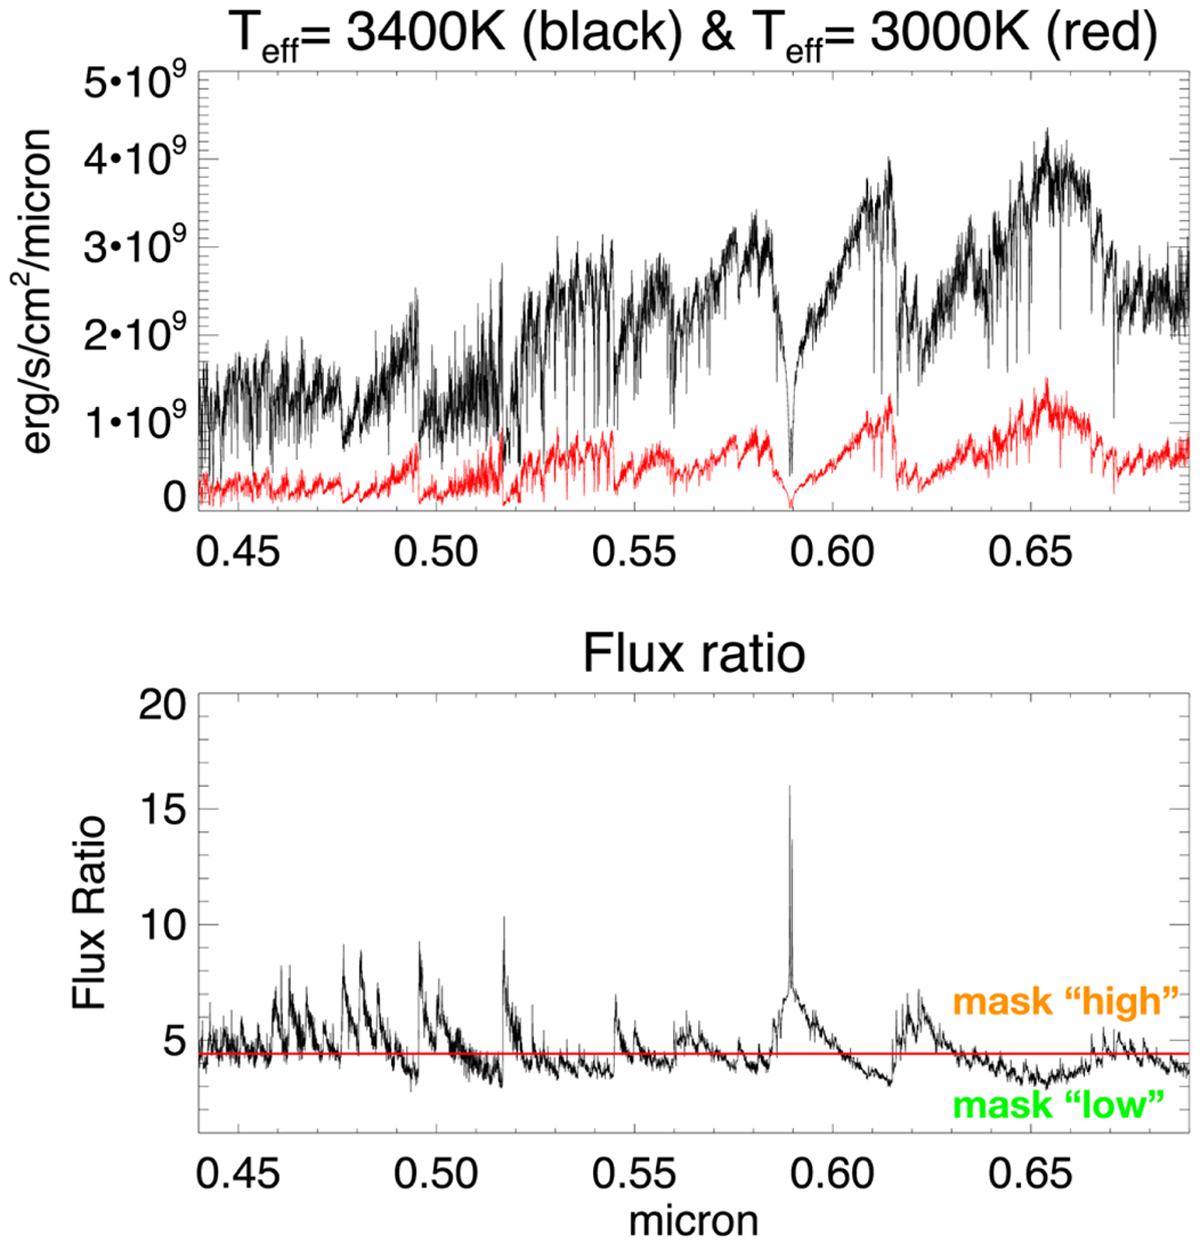
Regions in the optical spectra used to define the CCF masks to study the chromaticity of the SOPHIE RVs. Upper panel: theoretical PHOENIX medium resolution models of stellar atmospheres with Teff = 3400 and 3000 K in the SOPHIE wavelength range. Lower panel: Flux ratio of the atmosphere models of the upper panel. The horizontal red line is the median flux ratio. Lines of the SOPHIE M-star mask in the regions over the median flux ratio constitute the high-contrast mask, and the lines located below the median constitute the low-contrast mask.
Current usage metrics show cumulative count of Article Views (full-text article views including HTML views, PDF and ePub downloads, according to the available data) and Abstracts Views on Vision4Press platform.
Data correspond to usage on the plateform after 2015. The current usage metrics is available 48-96 hours after online publication and is updated daily on week days.
Initial download of the metrics may take a while.