Fig. 10

Download original image
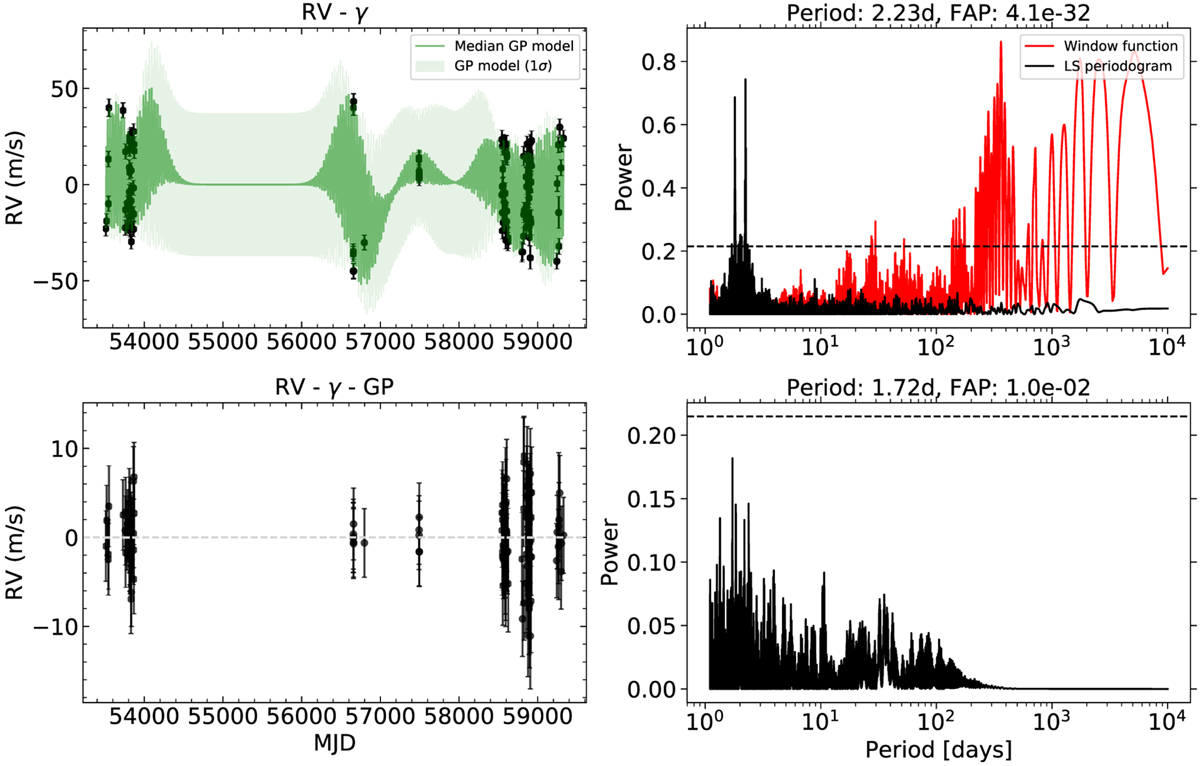
Summary of the GP analysis of the optical RV time series using SPIRou's Bℓ as an activity proxy. Upper left: QP GP fit (green line) to the HARPS and SOPHIE optical RV time series (black points). The median value of the raw RV is denoted by γ. Upper right: periodogram of the RV data and window function before the QP GP fit. The horizontal line is the FAP = 0.1%. Lower left: residuals in the optical RVs after the subtraction of the QP GP fit. Lower right: periodogram of the RV residuals after subtraction of the QP GP fit. In the top of each periodogram, the period, and FAP of the strongest peak are given. Details of the GP model are summarized in Table 6. The corner plot of the fit is given in Fig. B.2.
Current usage metrics show cumulative count of Article Views (full-text article views including HTML views, PDF and ePub downloads, according to the available data) and Abstracts Views on Vision4Press platform.
Data correspond to usage on the plateform after 2015. The current usage metrics is available 48-96 hours after online publication and is updated daily on week days.
Initial download of the metrics may take a while.


