Fig. 5
Download original image
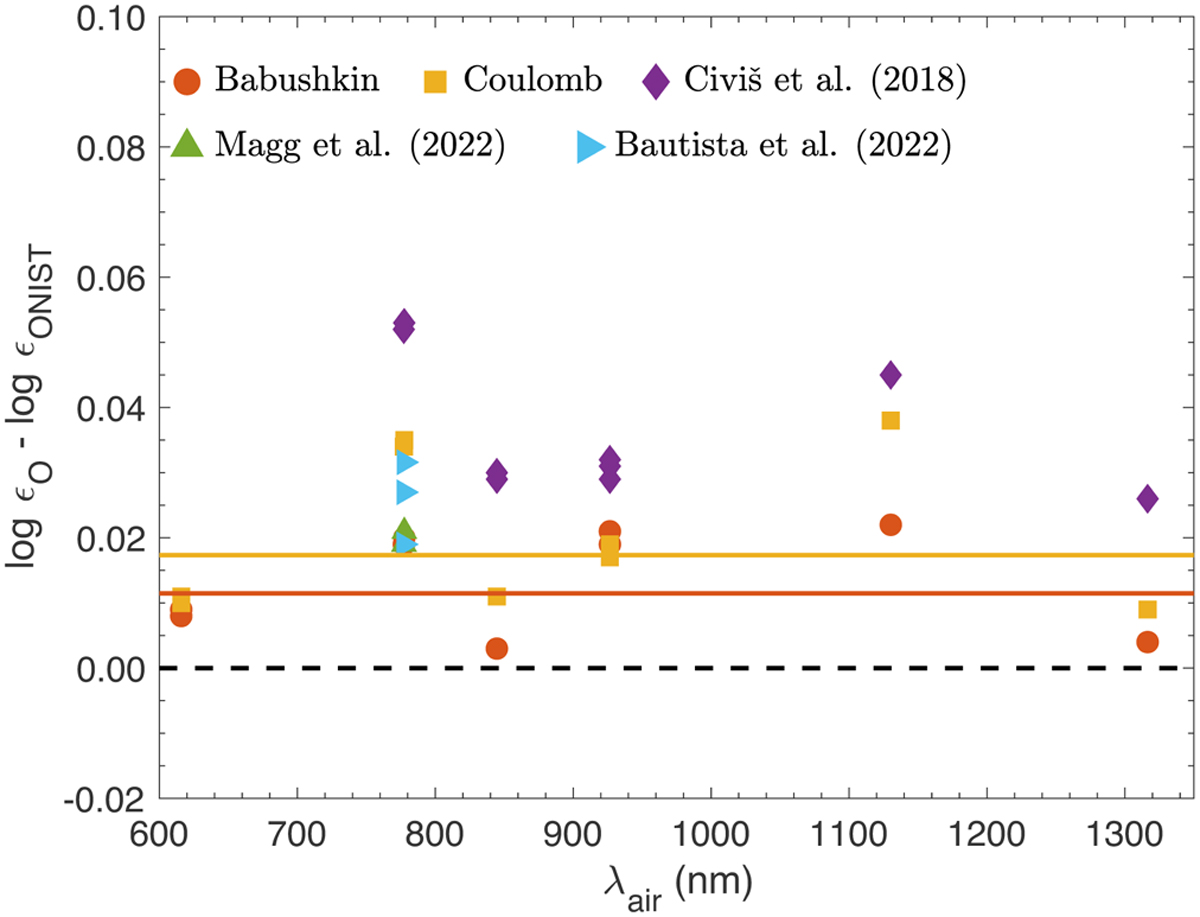
Solar oxygen abundance differences inferred using different theoretical transition data given in Table 6, relative to the NIST-ASD values. Red circle: Babushkin gauge from present work. Orange square: Coulomb gauge from present work. Purple diamond: Civiš et al. (2018). Green upwards triangle: Magg et al. (2022). Blue right triangle: Bautista et al. (2022). Red and blue solid horizontal lines: Mean result for the Babushkin gauge and Coulomb gauge, respectively. Note: we give equal weights to all LS features.
Current usage metrics show cumulative count of Article Views (full-text article views including HTML views, PDF and ePub downloads, according to the available data) and Abstracts Views on Vision4Press platform.
Data correspond to usage on the plateform after 2015. The current usage metrics is available 48-96 hours after online publication and is updated daily on week days.
Initial download of the metrics may take a while.