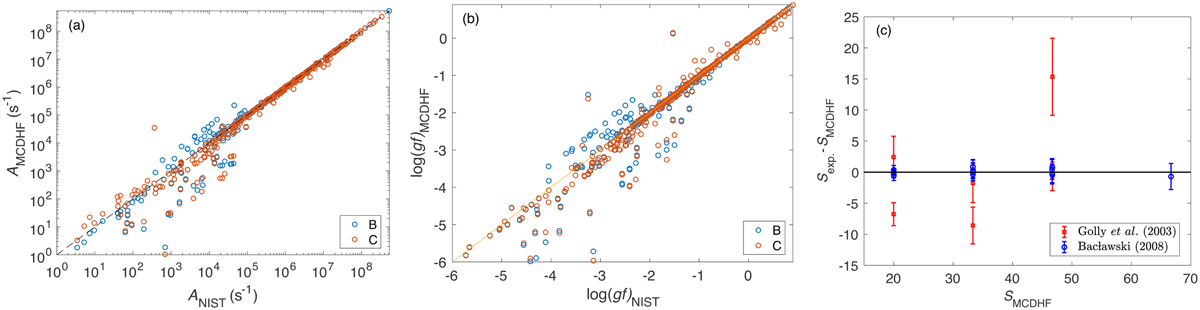
Fig. 2
Download original image
Comparison of transition data of the current study with the values from other work. Panel a: comparison of theoretical transition probabilities, A, in both Babushkin (B) and Coulomb (C) gauge with the results available in the NIST-ASD (Kramida et al. 2022). Panel b: comparison of the log(gf) values in Babushkin form with the results from CIV3 (Hibbert et al. 1991), MCHF (Tachiev & Froese Fischer 2002) and B-spline R-matrix (Tayal 2009) calculations. Panel c: comparison of the theoretical line strengths, SMCDHF, with the corresponding experimental results published by Golly et al. (2003, in red square) and Bacławski (2008, in blue circle). Note: Relative line strengths were provided by Bacławski (2008), which means that the line strengths are normalised within each multiplet to the sum of 100; the corresponding results from present calculations and Golly et al. (2003) were done with the same procedure. The line strengths in Babushkin gauge were used for the comparison.
Current usage metrics show cumulative count of Article Views (full-text article views including HTML views, PDF and ePub downloads, according to the available data) and Abstracts Views on Vision4Press platform.
Data correspond to usage on the plateform after 2015. The current usage metrics is available 48-96 hours after online publication and is updated daily on week days.
Initial download of the metrics may take a while.