Open Access
Fig. 1
Download original image
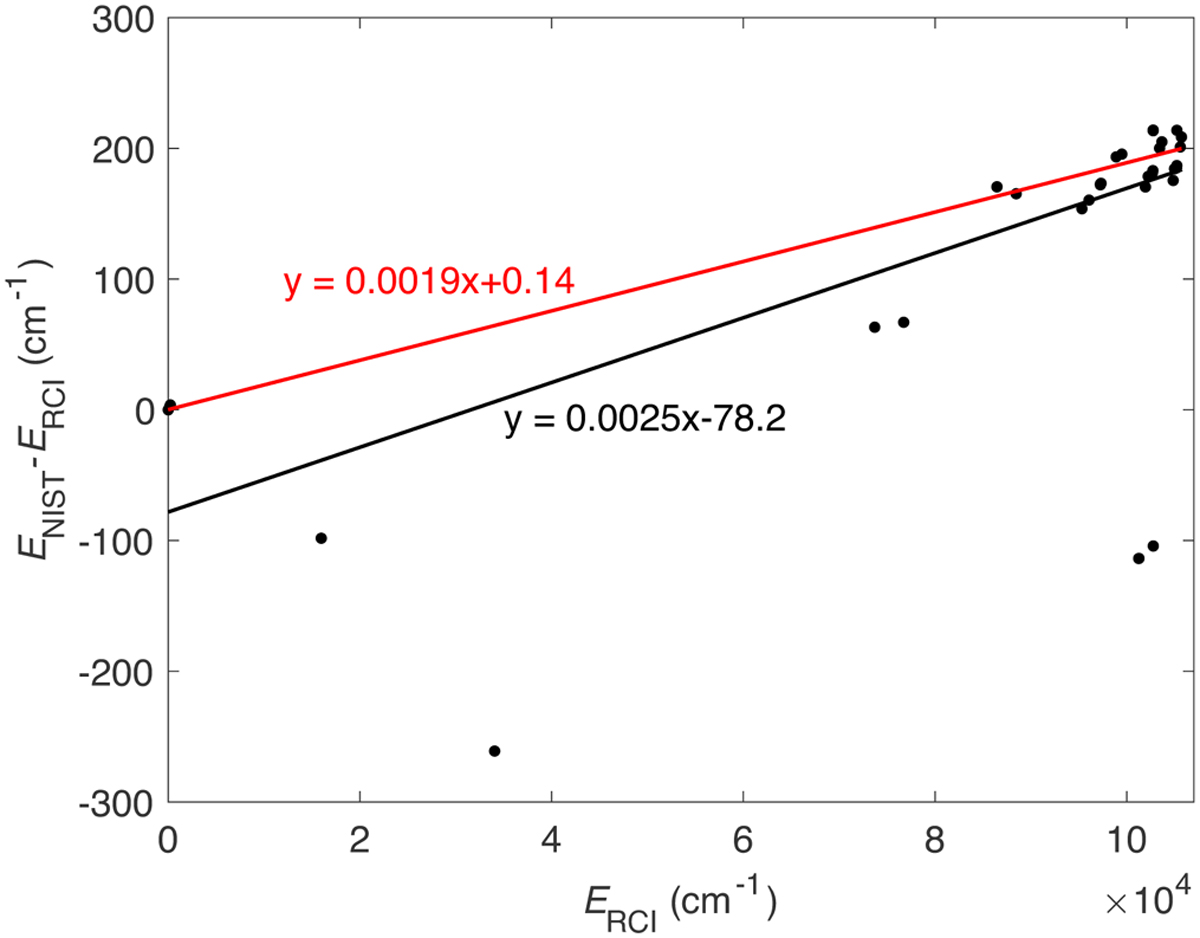
Energy differences along with present computed excitation energies. The black solid line is the linear fit to the scatter data shown in the figure. The red solid line is the linear fit by excluding the 2s22p4 1D2, 1S0, 2s22p33s 5S2,3S1, 3D1,2,3, and 1D2 states.
Current usage metrics show cumulative count of Article Views (full-text article views including HTML views, PDF and ePub downloads, according to the available data) and Abstracts Views on Vision4Press platform.
Data correspond to usage on the plateform after 2015. The current usage metrics is available 48-96 hours after online publication and is updated daily on week days.
Initial download of the metrics may take a while.